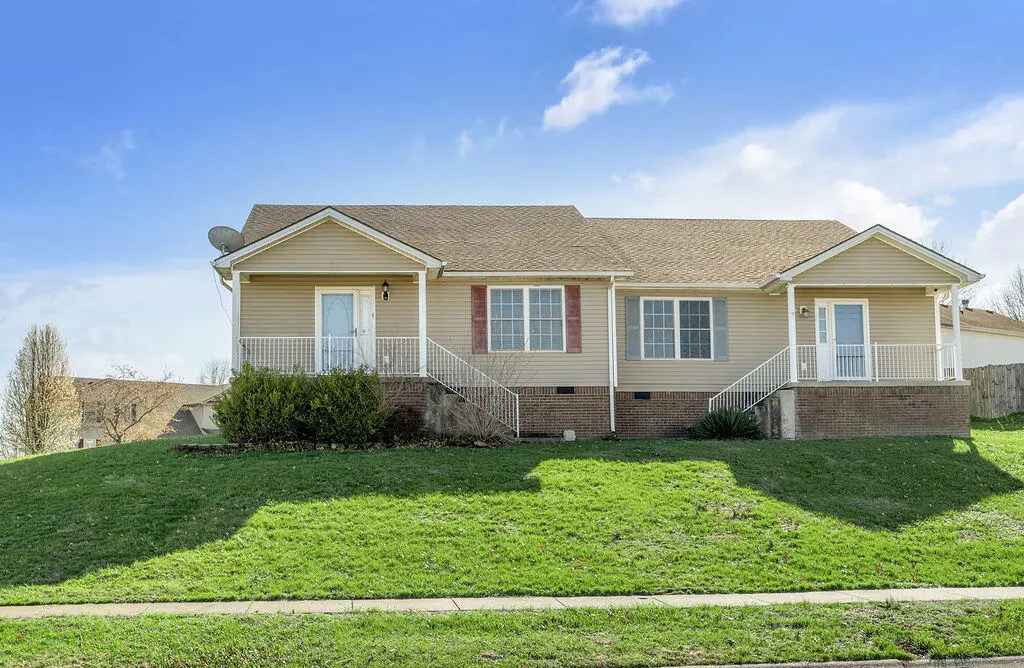
128 Bay Hill Dr
Winchester, KY 40391
$200,000F
3 bd · 2.0 ba ·
1,289 sqft ·
Built 2003
· SingleFamily
· Active
· 29 DOM
Cashflow @ list (25.0% down · 7.5%)
Estimated rent
$1,580/mo
Mortgage (P&I)
−$1,049
Tax + insurance
−$156
HOA
−$33
Vac / Maint / Mgmt
−$332
Net cashflow
$10/mo
Annual
$120/yr
Cap rate
6.35%
Cash-on-cash
0.21%
DSCR
1.01
1% rule
0.79%
Cash to close
$56,000
Investor read
- This is a 3-bed/2.0-bath single-family listed at $200k.
- At list price, monthly cash flow is $10 ($120/yr) — positive.
- The deal already cash-flows at list — no discount required.
- To meet the 1% rule (rent ≥ 1% of price), the offer needs to be $158k (21.0% below list).
- It's been on market 29 days — a 2% lower offer ($197k) is reasonable based on typical stale-listing flexibility.
- Recommended offer: $158k (21.0% below list) — sets the bar for 1% rule.
- Local home prices are declining (-3.0%/yr); year-one equity from $1k of loan paydown is wiped out by about $6k of value loss. Plan a longer hold.
- Location reads 60/100 on livability (#393 in KY) — a middle-class / working-renter tenant base. Strengths: cost of living A+, housing A+; Watch: amenities F, commute F, employment F.
- Clark County (town): math 28% / reading 41% proficiency, ranked #64 of 165 in KY (top 39%) — families likely to look elsewhere, expect single-tenant / working-renter base with shorter leases.
- Zoned schools: Willis H. Justice Elementary School (math 27% / reading 27%, grade F, #434 of 676 statewide, top 69%, 427 students, 66% FRL); Robert D. Campbell Jr. High (math 28% / reading 47%, grade F, #73 of 217 statewide, top 36%, 820 students, 57% FRL).
- Market conditions: 291 active listings in the ZIP; 1 comparable units currently listed for rent nearby; 160 units permitted in Clark County in 2024 (61 in 5+ unit buildings).
- Clark County population projected to shrink 7% by 2050 — rents likely to lag national; underwrite the cash flow, not the appreciation.
- 6 sale attempts since 8y ago with the ask held roughly flat each time — persistent listings suggest the price (not the market) is what's stuck; bring a comps-based counter.
- Current owner paid $140k; 43% above their basis — modest negotiation headroom, anchor on the comps not their cost.
- Cap rate 6.4% vs local median 4.0% in Winchester — top-decile yield for the area; either an underpriced asset or a hidden risk that comps aren't pricing in. Stress-test before assuming the spread holds.
Questions for listing agent
- What does the HOA fee cover, when was the last increase, and are there any pending special assessments or reserve-fund shortfalls?
- Is there a deadline driving the sale (1031 exchange, divorce, estate, relocation)? That informs how much negotiation room exists.
- Schools are D-rated, which usually means shorter tenancies and higher turnover. Who's the typical renter profile here, and what's been the actual vacancy rate?
- The area grade is low — what's the realistic commute time and amenity access for the typical tenant pool here? Any planned neighborhood developments (good or bad) we should know about?
- What's the average days-on-market for RENTAL listings here right now (not sales)? A rising rental-DOM trend means longer vacancies and softer asking-rent achievability than the comps imply.
- What's the recent tenant-quality profile in this submarket — average credit score on applications, eviction rate, late-payment / NSF rate, and stable-employment percentage? A property-management company in the area should have these aggregated.
- How much new for-sale + rental construction is in the pipeline within 1–3 miles? Heavy new supply typically softens prices + rents 12–24 months out; constrained supply supports both.
CashFlowRE · CFR-RVEFB6BW1NH0JM
· Data 2 days ago
cashflowre.app · 2026-05-29