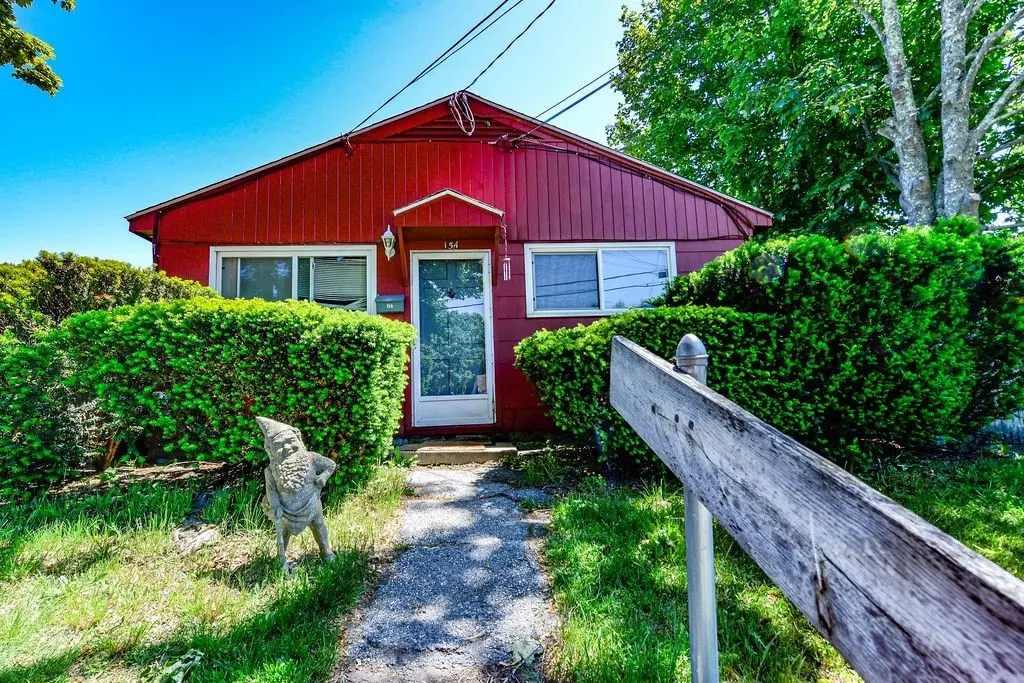
15 A & B Ludlow Rd
Newport East, RI 02842
$550,000C-
4 bd · 2.0 ba ·
1,587 sqft ·
Built 1954
· MultiFamily
· Pending
· 5 DOM
Cashflow @ list (25.0% down · 7.5%)
Estimated rent
$5,430/mo
Mortgage (P&I)
−$2,884
Tax + insurance
−$917
HOA
−$0
Vac / Maint / Mgmt
−$1,140
Net cashflow
$489/mo
Annual
$5,865/yr
Cap rate
7.36%
Cash-on-cash
3.81%
DSCR
1.17
1% rule
0.99%
Cash to close
$154,000
Investor read
- This is a 1×2bd/1.0ba + 1×3bd/1.0ba units multifamily listed at $550k. Condition is rated good.
- At list price, monthly cash flow is $489 ($6k/yr) — positive. Per door: $244/mo.
- The deal already cash-flows at list — no discount required.
- To meet the 1% rule (rent ≥ 1% of price), the offer needs to be $543k (1.3% below list).
- Only 5 days on market — expect competitive offers; lowballing is unlikely to land.
- Recommended offer: $543k (1.3% below list) — sets the bar for 1% rule.
- Local home prices are declining (-3.0%/yr); year-one equity from $4k of loan paydown is wiped out by about $16k of value loss. Plan a longer hold.
- Location reads 81/100 on livability (#3 in RI, #1,592 nationally) — a professional / high-income tenant draw. Strengths: crime A+, amenities A+, health & safety A+; Watch: commute F, cost of living F.
- Middletown (suburban): math 24% / reading 38% proficiency, ranked #20 of 39 in RI (top 51%) — families likely to look elsewhere, expect single-tenant / working-renter base with shorter leases.
- Watch-outs: built in 1954 — expect roof / HVAC / electrical / plumbing capex.
- Market conditions: Rents rising fast (+5.6%/yr); 67 active listings in the ZIP; 13 comparable units currently listed for rent nearby; rentals leasing fast (median 4d on market — plan ~1-2 weeks tenant-placement turnaround); solid renter incomes; 94 units permitted in Newport County in 2024 (0 in 5+ unit buildings).
- Newport County population projected at -12% by 2050 — secular population decline; favor cash flow + early exit over multi-decade hold.
- Climate carrying-cost: severe wind risk, 80% chance of damaging wind over 30y; extreme-heat days projected 7→17/yr by 2055 (HVAC capex compounding) — expect insurance premiums to compound above CPI over the hold.
- At $5,430/mo this rent would consume 64% of the median local household income ($102k/yr) (locally 739% of renters already pay >50% of income on rent) — very limited rent-growth headroom before tenants either downsize or default.
Questions for listing agent
- Can we see the unit-by-unit rent roll, current vacancy, and any below-market leases? What's the average tenancy length?
- What capital expenditures (roof, boiler, parking lot, exteriors) have been made in the last 5 years, and what's planned in the next 2?
- Built in 1954 — when were the roof, HVAC, electrical panel, plumbing, and water heater last replaced?
- Is there a deadline driving the sale (1031 exchange, divorce, estate, relocation)? That informs how much negotiation room exists.
- What's the average days-on-market for RENTAL listings here right now (not sales)? A rising rental-DOM trend means longer vacancies and softer asking-rent achievability than the comps imply.
- What's the recent tenant-quality profile in this submarket — average credit score on applications, eviction rate, late-payment / NSF rate, and stable-employment percentage? A property-management company in the area should have these aggregated.
- How much new apartment / multifamily construction is in the pipeline within 1–3 miles? Heavy new supply (>2% of stock underway) typically softens rents 12–24 months out; light construction supports rent growth.
CashFlowRE · CFR-RVEP5J0GHH7KCQ
· Data 6 days ago
cashflowre.app · 2026-05-29