 Duplex
15 A & B Ludlow Rd · Newport East, RI
Flood risk 1/10 · Minimal
- FEMA flood zone
- X (unshaded)
- Chance of flooding over 30 yrs
- 0.0%
- Est. flood insurance / yr
- $507 – $1,088
Fire risk 1/10 · Minimal
- Est. fire insurance / yr
- $835 – $1,551
Heat risk 6/10 · Moderate
- Hot days now (above 90°F)
- 7 days/yr
- Hot days in 30 yrs
- 17 days/yr
Wind risk 8/10 · Major
- Chance of severe wind over 30 yrs
- 80.0%
Air-quality risk 2/10 · Minimal
- Unhealthy air days now
- 2 days/yr
- Unhealthy air days in 30 yrs
- 2 days/yr
Risk factors via First Street. Map © Google.
Why this score? — see what drove the C- grade
The composite is a weighted blend of 9 inputs, each scored 0–100. Each bar is that input's sub-score; the figure is the points it added to the 100-point composite (weight × sub-score).
- Cash flow +18.2/30.0
- ARV discount +11.4/15.0
- DSCR +5.7/10.0
- 1% rule +4.9/10.0
- Livability +4.0/5.0
- Rent growth +3.9/5.0
- Condition / age +3.8/5.0
- Schools +2.9/10.0
- Appreciation +0.0/10.0
$550,000
🖨 Deal sheet 📄 Offer letter ✓ Due diligence
Multi-family units
County records classify this as Multi-Family (2-4 Unit). Listing-text estimate: 2 units. confirmed
Listing remarks
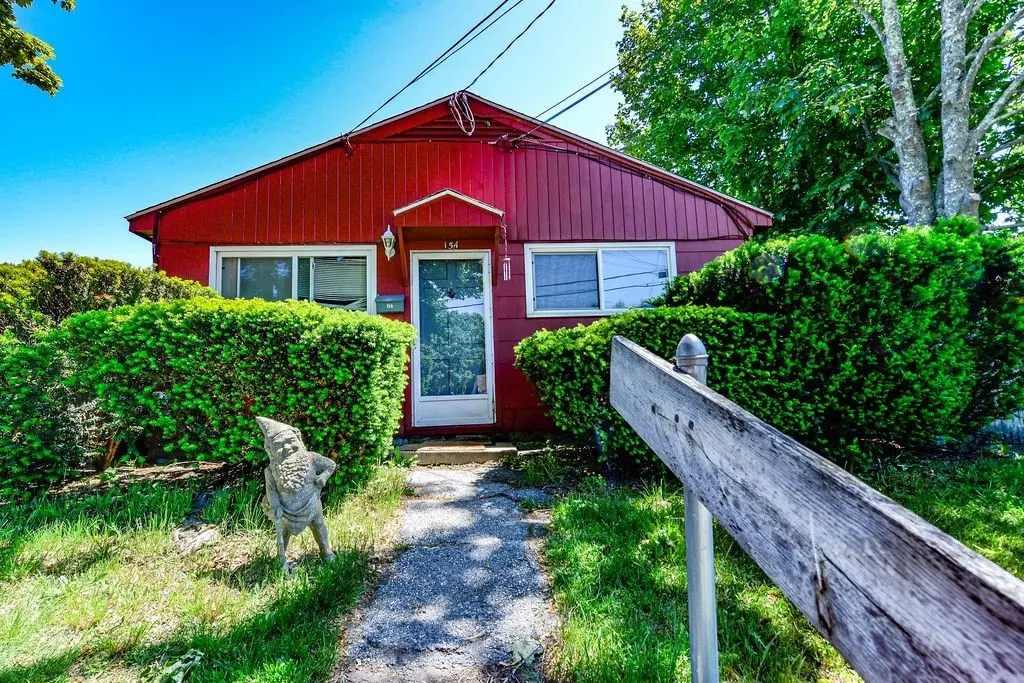
This side-by-side duplex, situated on a desirable corner lot in a central Middletown location, offers a fantastic investment opportunity or perfect owner-occupied home. One-unit features 2 spacious bedrooms, while the other boasts 3 bedrooms, providing flexibility to accommodate different needs. Both units enjoy single-level living, making them accessible and convenient. Each side has separate gas heating and electric systems to ensure independent control and comfort. Additionally, the property includes a large shed with electricity, adding valuable storage and utility space. This well-located duplex combines practicality with great accessibility to schools, shopping, bus line and more.
Key facts
- 8,336 sq ft lot
- 4 parking spots
- Built 1954
Property features AI
Finance
- Financial info: Tenant pays hot water; Unit rents: Three-bedroom unit currently $1,875; Two-bedroom unit currently $1,650
- HOA & community: Near schools, public transportation, shopping, and sidewalks
Exterior
- Parking: No garage; Four off-street parking spaces
- Utilities: Public water; Public sewer (connected); 100-amp electrical service with circuit breakers
- Home design: Duplex (2-unit building); Single-story; Above-grade finished area about 1,587
- Construction: Drywall and plaster construction; Slab foundation
- Exterior features: Outbuilding; Corner lot; 175' frontage
Interior
- Kitchen: Oven; Range; Refrigerator
- Bedrooms: One unit with three bedrooms; One unit with two bedrooms
- Flooring: Laminate; Vinyl
- Bathrooms: Two full bathrooms (total in building) — each unit has one full bathroom
- Heating & cooling: Forced air heating; Gas heating
- Interior features: Storm door(s); Attic storage; Tub/shower
- Laundry & utility: In-unit laundry; Gas water heater; Water heater
Neighborhood map
What this means for you Summary
Snapshot
- This is a 1×2bd/1.0ba + 1×3bd/1.0ba units multifamily listed at $550k. Condition is rated good.
Deal economics
- At list price, monthly cash flow is $489 ($6k/yr) — positive. Per door: $244/mo.
- The deal already cash-flows at list — no discount required.
- To meet the 1% rule (rent ≥ 1% of price), the offer needs to be $543k (1.3% below list).
- Recommended offer: $543k (1.3% below list) — sets the bar for 1% rule.
Location & tenants
- Location reads 81/100 on livability (#3 in RI, #1,592 nationally) — a professional / high-income tenant draw. Strengths: crime A+, amenities A+, health & safety A+; Watch: commute F, cost of living F.
- Middletown (suburban): math 24% / reading 38% proficiency, ranked #20 of 39 in RI (top 51%) — families likely to look elsewhere, expect single-tenant / working-renter base with shorter leases.
- Market conditions: Rents rising fast (+5.6%/yr); 67 active listings in the ZIP; 13 comparable units currently listed for rent nearby; rentals leasing fast (median 4d on market — plan ~1-2 weeks tenant-placement turnaround); solid renter incomes; 94 units permitted in Newport County in 2024 (0 in 5+ unit buildings).
- At $5,430/mo this rent would consume 64% of the median local household income ($102k/yr) (locally 739% of renters already pay >50% of income on rent) — very limited rent-growth headroom before tenants either downsize or default.
Forward outlook
- Local home prices are declining (-3.0%/yr); year-one equity from $4k of loan paydown is wiped out by about $16k of value loss. Plan a longer hold.
- Newport County population projected at -12% by 2050 — secular population decline; favor cash flow + early exit over multi-decade hold.
Negotiation context
- Only 5 days on market — expect competitive offers; lowballing is unlikely to land.
Risks & watch-outs
- Watch-outs: built in 1954 — expect roof / HVAC / electrical / plumbing capex.
- Climate carrying-cost: severe wind risk, 80% chance of damaging wind over 30y; extreme-heat days projected 7→17/yr by 2055 (HVAC capex compounding) — expect insurance premiums to compound above CPI over the hold.
Questions for the listing agent
- Can we see the unit-by-unit rent roll, current vacancy, and any below-market leases? What's the average tenancy length?
- What capital expenditures (roof, boiler, parking lot, exteriors) have been made in the last 5 years, and what's planned in the next 2?
- Built in 1954 — when were the roof, HVAC, electrical panel, plumbing, and water heater last replaced?
- Is there a deadline driving the sale (1031 exchange, divorce, estate, relocation)? That informs how much negotiation room exists.
- What's the average days-on-market for RENTAL listings here right now (not sales)? A rising rental-DOM trend means longer vacancies and softer asking-rent achievability than the comps imply.
- What's the recent tenant-quality profile in this submarket — average credit score on applications, eviction rate, late-payment / NSF rate, and stable-employment percentage? A property-management company in the area should have these aggregated.
- How much new apartment / multifamily construction is in the pipeline within 1–3 miles? Heavy new supply (>2% of stock underway) typically softens rents 12–24 months out; light construction supports rent growth.
Investment metrics
- 1% rule
- 0.99% ✗
- Cap rate
- 7.36%
- Cash-on-cash
- 3.81%
- DSCR
- 1.17
- GRM
- 8.4
CMA / ARV
- ARV (on-the-fly)
- $601,473
- Comps found
- 3
Show comp detail 3 sales within ~0.75 mi
| Address | Dist | Beds/Ba | Sqft | Sold | Price | $/sf | Match |
|---|---|---|---|---|---|---|---|
| 22 Ludlow Rd | 0.03mi | 4/2.0 | 1,426 (-10%) | 1mo | $540,000 | $379 | 81 |
| 13 Woolsey Rd | 0.17mi | 5/2.0 (+1) | 1,587 (0%) | 17mo | $530,000 | $334 | 73 |
| 1 Buck Rd | 0.12mi | 4/6.5 | 1,426 (-10%) | 12mo | $550,000 | $386 | 49 |
Match score weights: distance 35% · size 25% · config 20% · recency 20%. Top-matched comps best support the ARV.
Projected returns pro-forma
-3.0% appreciation · 5.59% rent growth · sell at horizon
- IRR
- -7.4%
- Equity multiple
- 0.72×
- Total profit
- $-43,395
- Equity at exit
- $82,007
- IRR
- 5.2%
- Equity multiple
- 1.42×
- Total profit
- $65,447
- Equity at exit
- $47,554
Cash invested: $154,000 (down + closing). Projections, not guarantees.
Landlord ↔ Tenant lean methodology
- Overall (STATE)
- 31 Tenant-Leaning
- State Rhode Island
- 31 Tenant-Leaning · D+8
- County
- — inherits STATE
- City
- — inherits STATE
ZIP-level market 02842
- Home prices YoY
- -30.6%
- Rents YoY
- 5.6%
- Active inventory
- 67
- Price-to-rent
- 17.7×
Monthly cashflow live
- Estimated rent
- $5,430 high interval (Pro) →
- Mortgage (P&I)
- −$2,884
- Tax est. 1.5%
- −$688 /mo · $8,250/yr
- Insurance
- −$229
- HOA
- −$0
- Vacancy / Maint / Mgmt
- −$1,140
- Net cashflow
- $489
Break-even live
2-unit breakdown (identical units grouped — click to expand)
| Units | Beds | Baths | Est. rent |
|---|---|---|---|
| 1× unit | 2 | 1 | $2,587 |
| 1× unit | 3 | 1 | $2,843 |
| Total (2 units) | $5,430 | ||
UW: 25.0% down · 7.5% · 30yr · 1.5% tax · 5.0% vac · 8.0% maint · 8.0% mgmt
Financing live
Cash to close
- Down payment
- $137,500
- Closing costs
- $16,500
- Reserves months
- —
- Total cash needed
- —
Loan-product check · same deal, 3 products live
Conventional
25% down · 7.5% · 30yr
- Down + closing
- —
- Monthly P&I
- —
- Monthly cashflow
- —
- DSCR
- —
- Eligible?
- —
Personal DTI + credit; lowest rate.
DSCR
20% down · 8.5% · 30yr
- Down + closing
- —
- Monthly P&I
- —
- Monthly cashflow
- —
- DSCR
- —
- Eligible?
- —
No personal income docs; deal must DSCR.
Hard money
10% down · 12.0% · 12mo
- Down + closing
- —
- Monthly P&I
- —
- Monthly cashflow
- —
- DSCR
- —
- Eligible?
- —
Short-term bridge; refi at stabilization.
Rent comps 13 comps
| Address | Beds | Baths | Sqft | Rent | $/sqft | DOM | Units | Dist |
|---|---|---|---|---|---|---|---|---|
| 8 Constitution Ave Middletown, RI | 2.0–3.0 | 1.5–2.5 | 1200 | $3,999 | $3.33 | 1d | 1 | 0.50mi |
| 10 Reardon Dr Middletown, RI | 3.0 | 1.0 | 2200 | $3,300 | $1.50 | 23d | 1 | 0.56mi |
| 2 Bailey Ter Middletown, RI | 3.0 | 2.5 | 1947 | $5,000 | $2.57 | 4d | 1 | 0.94mi |
| 384 Valley Rd Middletown, RI | 4.0 | 3.0 | 2048 | $4,000 | $1.95 | 23d | 1 | 1.05mi |
| 123 Beacon St Middletown, RI | 4.0 | 3.0 | 2000 | $3,600 | $1.80 | 3d | 1 | 1.06mi |
| 12 Granada Ter Middletown, RI | 4.0 | 2.0 | 1834 | $3,800 | $2.07 | 1d | 1 | 1.09mi |
| 7 Restmere Ter Unit A Middletown, RI | 3.0 | 2.0 | 1200 | $3,800 | $3.17 | 4d | 1 | 1.19mi |
| 1 Collins Ter Middletown, RI | 3.0 | 1.0 | 1162 | $3,400 | $2.93 | 23d | 1 | 1.27mi |
| 41 Dudley Ave Newport, RI | 3.0 | 2.0 | 1381 | $3,450 | $2.50 | 1d | 1 | 1.34mi |
| 2 E BLVD Unit 2 Middletown, RI | 3.0 | 2.0 | 1344 | $3,300 | $2.46 | 23d | 1 | 1.45mi |
| 9 Apthorp Ave #2 Newport, RI | 3.0 | 2.0 | 1320 | $3,500 | $2.65 | 23d | 1 | 1.46mi |
| 7 Boulevard E Middletown, RI | 3.0 | 1.5 | 1680 | $9,000 | $5.36 | 23d | 1 | 1.48mi |
| 52 Bedlow Ave Newport, RI | 3.0 | 2.5 | 1544 | $4,200 | $2.72 | 1d | 1 | 1.50mi |
Listing history 4 events
-
2026-06-13statusdays on market $550,000 Pending 5 DOM
-
2026-06-09days on market $550,000 Active 2 DOM
-
2026-06-08remarks 695-char remark
-
2026-06-08$550,000 Active 1 DOM
ⓘ Source: listings_history table (triggers on properties + properties_extension) + one-shot
backfill from property_details.listing_events for pre-trigger history.
Climate risk First Street
- Flood 1/10 Low FEMA zone X (unshaded) · 0% chance over 30 yrs
- Wildfire 1/10 Low
- Heat 6/10 Major 7 d/yr ≥90°F today · 17 d/yr by 30 yrs out
- Wind 8/10 Severe 80% chance of damaging wind over 30 yrs
- Air quality 2/10 Low 2 unhealthy d/yr today · 2 by 30 yrs out
Nearby sold comps map
Loading sold comps map…
Walkable amenities ~0.75 mi
Loading nearby amenities…
Taxation est. · year 1
- Rental income
- $65,160
- − Mortgage interest
- −$30,809
- − Property taxes
- −$8,250
- − Insurance
- −$2,750
- − Repairs & maintenance
- −$5,213
- − Management
- −$5,213
- − Depreciation
- −$16,000
- Taxable loss
- −$3,074
- Est. tax savings @ 24.0%
- +$738
- After-tax cash flow
- $6,603/yr
For passive investors: Depreciation is non-cash, so a rental often shows a tax loss while cash-flowing — sheltering income. Rental losses are passive: they offset passive income freely, and up to $25,000/yr can offset ordinary (W-2) income if you actively participate and your MAGI is under $100k (phasing out to $0 by $150k); unused losses carry forward. On sale, claimed depreciation is recaptured at up to 25%, and gains may owe capital-gains tax (a 1031 exchange can defer both). Figures are a year-1 estimate at your 24.0% rate — not tax advice; consult a CPA.
Condition & rehab AI · 10 photos
This well-maintained, side-by-side duplex is ready for a fresh coat of paint and some interior updates to maximize its value.
Value-add opportunities
- Both Paint exterior — Enhances curb appeal and value
- Both Replace carpet with hardwood — Improves aesthetics and value
- Both Update kitchen appliances — Modernizes the space and attracts buyers
Renovation cost estimate screening
Value-add ROI direction
- Both Paint exterior — Enhances curb appeal and value ↑
- Both Replace carpet with hardwood — Improves aesthetics and value ↑
- Both Update kitchen appliances — Modernizes the space and attracts buyers ↑
ⓘ Cost ranges are severity-bucket heuristics (US national rule-of-thumb). Get contractor quotes + a written scope before underwriting a rehab budget.
Schools (NCES district)
- District
- Middletown
- NCES district ID
- 4400630
- Math proficiency
- 24% ▼ -9.00%
- Reading proficiency
- 38% ▼ -4.00%
- Median HH income
- $66,845
- Composite
- 28.59/100
- National rank
- #6717
- State rank
- #20 of 39 in RI
Livability — Newport East
- Score
- 81/100
- State rank
- #3
- US rank
- #1592
Category grades
Schools grade is shown separately in the Schools card above.
Census & demographics
- Census place
- Newport East, RI
- County
- Newport County · 73,957 people
- Metro
- Providence-Warwick, RI-MA
- Population (ZIP)
- 16,832
- Household income
- $101,948
- Rent vs Own
- Severe rent burden
- 739.0
Population outlook (Newport County) Hauer SSP2
- Today (2025)
- 81,198 people
- By 2030
- 79,518 · -2.1%
- By 2040
- 75,581 · -6.9%
- By 2050
- 71,801 · -11.6%
- By 2075
- 64,618 · -20.4%
- By 2100
- 56,724 · -30.1%
Race, ethnicity, and origin ACS 2023
- Neighborhood character
- Predominantly White (79%)
- Race & ethnicity
- White 79% Two or more races 8% Hispanic / Latino 7% Black 4% Asian 3%
- Hispanic origin (detail)
- Mexican 1% Puerto Rican 2%
- Common ancestry
- Russian 11% Slovak 4% Romanian 3%
- Foreign-born
- 9% · Canada, China, Vietnam
- Languages at home
- 88% English-only · Other Indo-European 5% Spanish 4% Tagalog/Filipino 1%
Political lean MEDSL · Newport
- 2024 margin
- Strong D (+25.5) · D 61.6% · R 36.1% · Other 2.2%
- 2008→2024 swing
- +2.2pp toward D · 2008: 23.3pp · 2024: 25.5pp
- All cycles
- 2024: D+25.5 2020: D+29.8 2016: D+19.4 2012: D+17.7 2008: D+23.3
Not yet ingested
- Civics
- —
Market trends
- HPI YoY
- ▼ -164.89%
- Current HPI
- 374.2301
- Rent YoY
- ▲ 5.59%
- Metro
- Providence-Warwick, RI-MA
- State GDP YoY
- ▲ 2.25%
- F500 in state
- 10
Industry mix (Fortune 500 HQ in RI)
| Industry | F500 HQs | Revenue |
|---|---|---|
| Healthcare | 1 | $373B |
|
||
| Food Distribution | 1 | $31B |
|
||
| Aerospace / Defense | 1 | $14B |
|
||
| Financial Services | 1 | $8B |
|
||
| Consumer Goods | 1 | $4B |
|
||
Price history
1 event — show timeline
- 2026-06-08 Listed $550,000 RIS
Cash-flow waterfall
monthlySold comps — $/sqft
last 12 mo · ≤1 miLoading sold comps…