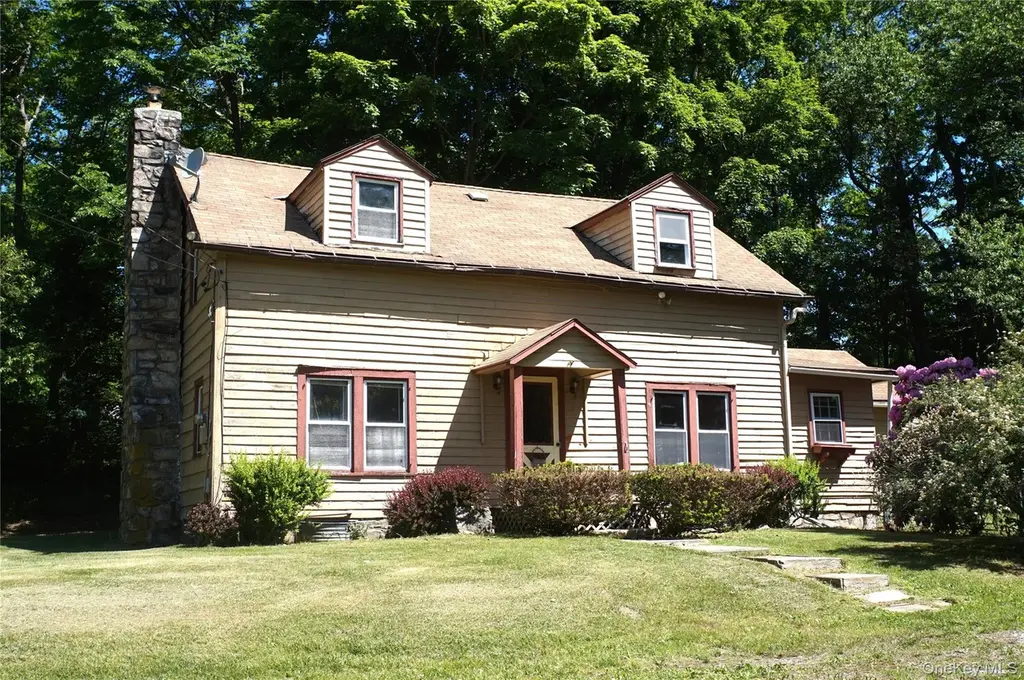
421 Stormville Mountain Rd
Shorehaven, NY 12582
$269,900C-
3 bd · 1.0 ba ·
1,540 sqft ·
Built 1770
· SingleFamily
· Active
· 11 DOM
Cashflow @ list (25.0% down · 7.5%)
Estimated rent
$2,881/mo
Mortgage (P&I)
−$1,415
Tax + insurance
−$835
HOA
−$0
Vac / Maint / Mgmt
−$605
Net cashflow
$25/mo
Annual
$302/yr
Cap rate
6.40%
Cash-on-cash
0.40%
DSCR
1.02
1% rule
1.07%
Cash to close
$75,572
Investor read
- This is a 3-bed/1.0-bath single-family listed at $270k.
- At list price, monthly cash flow is $25 ($302/yr) — positive.
- The deal already cash-flows at list — no discount required.
- Meets the 1% rule at list price ($3k rent vs $270k).
- Only 11 days on market — expect competitive offers; lowballing is unlikely to land.
- Local home prices are declining (-3.0%/yr); year-one equity from $2k of loan paydown is wiped out by about $8k of value loss. Plan a longer hold.
- Location reads: area grade C — affects rentability + tenant quality, not the cash-flow math above.
- Carmel Central School District (suburban): math 46% / reading 63% proficiency, ranked #258 of 590 in NY (top 44%) — acceptable for families but not a draw, mixed tenant base, ~2y average lease; only 17% free/reduced lunch — higher-income household profile.
- Zoned schools: Kent Elementary School (math 37% / reading 67%, grade C-, #988 of 2,108 statewide, top 49%, 394 students, 29% FRL); George Fischer Middle School (math 21% / reading 56%, grade F, #437 of 729 statewide, top 60%, 1,130 students, 38% FRL); Carmel High School (math 97% / reading 87%, grade A+, #171 of 1,100 statewide, top 18%, 1,365 students, 36% FRL) — zoned schools average 34% FRL vs 17% district-wide (18 pts higher); higher-poverty schools than district average — tighter screening recommended.
- Watch-outs: property tax is 3.2% of price; built in 1770 — expect roof / HVAC / electrical / plumbing capex.
- Market conditions: 29 active listings in the ZIP; 620 units permitted in Dutchess County in 2024 (242 in 5+ unit buildings).
- Dutchess County population projected at -11% by 2050 — secular population decline; favor cash flow + early exit over multi-decade hold.
- 7 sale attempts since 20y ago with the ask held roughly flat each time — persistent listings suggest the price (not the market) is what's stuck; bring a comps-based counter.
- Cap rate 6.4% vs local median 1.2% in Shorehaven — top-decile yield for the area; either an underpriced asset or a hidden risk that comps aren't pricing in. Stress-test before assuming the spread holds.
Questions for listing agent
- Built in 1770 — when were the roof, HVAC, electrical panel, plumbing, and water heater last replaced?
- Property tax is high relative to price — has the assessment been appealed recently, and will the sale trigger a re-assessment?
- Is there a deadline driving the sale (1031 exchange, divorce, estate, relocation)? That informs how much negotiation room exists.
- What's the average days-on-market for RENTAL listings here right now (not sales)? A rising rental-DOM trend means longer vacancies and softer asking-rent achievability than the comps imply.
- What's the recent tenant-quality profile in this submarket — average credit score on applications, eviction rate, late-payment / NSF rate, and stable-employment percentage? A property-management company in the area should have these aggregated.
- How much new for-sale + rental construction is in the pipeline within 1–3 miles? Heavy new supply typically softens prices + rents 12–24 months out; constrained supply supports both.
CashFlowRE · CFR-RVGBTX70MW6JVR
· Data 3 days ago
cashflowre.app · 2026-05-29