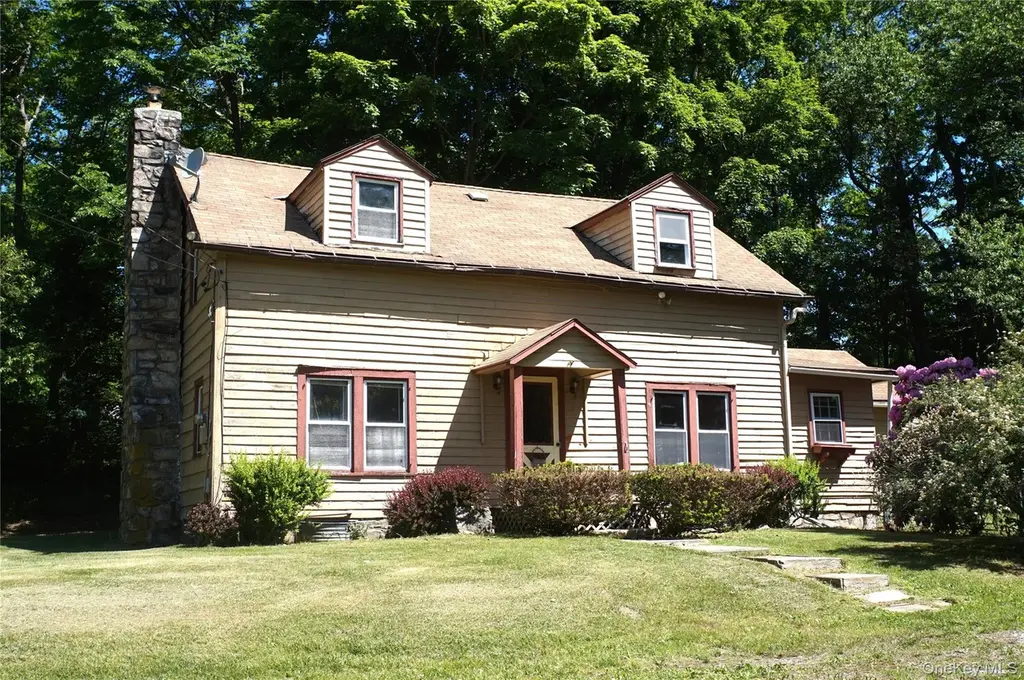
421 Stormville Mountain Rd · Shorehaven, NY
Flood risk 4/10 · Minor
- FEMA flood zone
- X (unshaded)
- Chance of flooding over 30 yrs
- 0.24%
- Est. flood insurance / yr
- $507 – $1,088
Fire risk 4/10 · Minor
- Est. fire insurance / yr
- $691 – $1,283
Heat risk 3/10 · Minor
- Hot days now (above 95°F)
- 6 days/yr
- Hot days in 30 yrs
- 13 days/yr
Wind risk 4/10 · Minor
- Chance of severe wind over 30 yrs
- 14.0%
Air-quality risk 3/10 · Minor
- Unhealthy air days now
- 2 days/yr
- Unhealthy air days in 30 yrs
- 3 days/yr
Risk factors via First Street. Map © Google.
Why this score? — see what drove the C- grade
The composite is a weighted blend of 9 inputs, each scored 0–100. Each bar is that input's sub-score; the figure is the points it added to the 100-point composite (weight × sub-score).
- ARV discount +15.0/15.0
- Cash flow +13.8/30.0
- 1% rule +5.7/10.0
- Schools +5.0/10.0
- DSCR +4.2/10.0
- Rent growth +2.5/5.0
- Livability +2.5/5.0
- Condition / age +2.5/5.0
- Appreciation +0.0/10.0
$269,900
🖨 Deal sheet 📄 Offer letter ✓ Due diligence
Listing remarks
Sitting on a perfect, park like lot in the highly sought after portion of East Fishkill with Carmel Schools is this turn of the century farmhouse, featuring 3 bedrooms, 2 full bathrooms, dining room, living room, large eat in kitchen, home office as well as a laundry room located on the main floor. Additionally, find an enormous 25 x 30 detached garage, perfect for the car enthusiast with the ability to store 6+ cars or for a home workshop. This is the ideal opportunity for an investor/flipper or someone looking to transform this historical house into their dream home. A rare opportunity in today's market to purchase a property that has tremendous upside at a discounted price with the abili
Key facts
- Park like lot
- Large eat in kitchen
- Detached garage
Tags
Property features AI
Exterior
- Parking: Total parking for 8 vehicles; Detached oversized garage with 6 garage spaces; Off-street parking and parking lot
- Utilities: Central Hudson electric; Septic tank; Cable connected; Electricity connected; Phone connected; Private trash collection
- Home design: Single-family residence; Two-story
- Construction: Frame construction; Stone foundation
- Exterior features: Outdoor lighting; Mailbox; Fenced yard; Level, private lot; Additional parcel(s) included
Interior
- Kitchen: Open kitchen
- Bathrooms: 2 full bathrooms
- Heating & cooling: Oil heating
- Interior features: First-floor full bathroom; Formal dining room; Open kitchen; Storage space; Washer/dryer hookup; Home office; Two levels; Full unfinished basement with Bilco doors, walk-out access and storage space
- Laundry & utility: Laundry room with washer hookup and gas dryer hookup
Neighborhood map
What this means for you Summary
Snapshot
- This is a 3-bed/1.0-bath single-family listed at $270k.
Deal economics
- At list price, monthly cash flow is $25 ($302/yr) — positive.
- The deal already cash-flows at list — no discount required.
- Meets the 1% rule at list price ($3k rent vs $270k).
- Cap rate 6.4% vs local median 1.2% in Shorehaven — top-decile yield for the area; either an underpriced asset or a hidden risk that comps aren't pricing in. Stress-test before assuming the spread holds.
Location & tenants
- Location reads: area grade C — affects rentability + tenant quality, not the cash-flow math above.
- Carmel Central School District (suburban): math 46% / reading 63% proficiency, ranked #258 of 590 in NY (top 44%) — acceptable for families but not a draw, mixed tenant base, ~2y average lease; only 17% free/reduced lunch — higher-income household profile.
- Zoned schools: Kent Elementary School (math 37% / reading 67%, grade C-, #988 of 2,108 statewide, top 49%, 394 students, 29% FRL); George Fischer Middle School (math 21% / reading 56%, grade F, #437 of 729 statewide, top 60%, 1,130 students, 38% FRL); Carmel High School (math 97% / reading 87%, grade A+, #171 of 1,100 statewide, top 18%, 1,365 students, 36% FRL) — zoned schools average 34% FRL vs 17% district-wide (18 pts higher); higher-poverty schools than district average — tighter screening recommended.
- Market conditions: 29 active listings in the ZIP; 620 units permitted in Dutchess County in 2024 (242 in 5+ unit buildings).
Forward outlook
- Local home prices are declining (-3.0%/yr); year-one equity from $2k of loan paydown is wiped out by about $8k of value loss. Plan a longer hold.
- Dutchess County population projected at -11% by 2050 — secular population decline; favor cash flow + early exit over multi-decade hold.
Negotiation context
- Only 11 days on market — expect competitive offers; lowballing is unlikely to land.
- 7 sale attempts since 20y ago with the ask held roughly flat each time — persistent listings suggest the price (not the market) is what's stuck; bring a comps-based counter.
Risks & watch-outs
- Watch-outs: property tax is 3.2% of price; built in 1770 — expect roof / HVAC / electrical / plumbing capex.
Questions for the listing agent
- Built in 1770 — when were the roof, HVAC, electrical panel, plumbing, and water heater last replaced?
- Property tax is high relative to price — has the assessment been appealed recently, and will the sale trigger a re-assessment?
- Is there a deadline driving the sale (1031 exchange, divorce, estate, relocation)? That informs how much negotiation room exists.
- What's the average days-on-market for RENTAL listings here right now (not sales)? A rising rental-DOM trend means longer vacancies and softer asking-rent achievability than the comps imply.
- What's the recent tenant-quality profile in this submarket — average credit score on applications, eviction rate, late-payment / NSF rate, and stable-employment percentage? A property-management company in the area should have these aggregated.
- How much new for-sale + rental construction is in the pipeline within 1–3 miles? Heavy new supply typically softens prices + rents 12–24 months out; constrained supply supports both.
Investment metrics
- 1% rule
- 1.07% ✓
- Cap rate
- 6.40%
- Cash-on-cash
- 0.40%
- DSCR
- 1.02
- GRM
- 7.8
CMA / ARV
- ARV (on-the-fly)
- $394,240
- Comps found
- 1
Show comp detail 1 sale within ~0.75 mi
| Address | Dist | Beds/Ba | Sqft | Sold | Price | $/sf | Match |
|---|---|---|---|---|---|---|---|
| 2 Candlewood Ct | 0.43mi | 3/1.5 | 1,600 (+4%) | 17mo | $410,000 | $256 | 57 |
Match score weights: distance 35% · size 25% · config 20% · recency 20%. Top-matched comps best support the ARV.
Projected returns pro-forma
-3.0% appreciation · 3.0% rent growth · sell at horizon
- IRR
- -15.5%
- Equity multiple
- 0.45×
- Total profit
- $-41,852
- Equity at exit
- $40,243
- IRR
- -6.9%
- Equity multiple
- 0.56×
- Total profit
- $-33,242
- Equity at exit
- $23,336
Cash invested: $75,572 (down + closing). Projections, not guarantees.
Landlord ↔ Tenant lean methodology
- Overall (STATE)
- 15 Strongly Tenant-Friendly
- State New York
- 15 Strongly Tenant-Friendly · D+10
- County
- — inherits STATE
- City
- — inherits STATE
ZIP-level market 12582
- Home prices YoY
- -6.9%
- Active inventory
- 29
- Price-to-rent
- 7.8×
Monthly cashflow live
- Estimated rent
- $2,881 medium interval (Pro) →
- Mortgage (P&I)
- −$1,415
- Tax from tax record
- −$723 /mo · $8,675/yr
- Insurance
- −$112
- HOA
- −$0
- Vacancy / Maint / Mgmt
- −$605
- Net cashflow
- $25
Break-even live
UW: 25.0% down · 7.5% · 30yr · 1.5% tax · 5.0% vac · 8.0% maint · 8.0% mgmt
Financing live
Cash to close
- Down payment
- $67,475
- Closing costs
- $8,097
- Reserves months
- —
- Total cash needed
- —
Loan-product check · same deal, 3 products live
Conventional
25% down · 7.5% · 30yr
- Down + closing
- —
- Monthly P&I
- —
- Monthly cashflow
- —
- DSCR
- —
- Eligible?
- —
Personal DTI + credit; lowest rate.
DSCR
20% down · 8.5% · 30yr
- Down + closing
- —
- Monthly P&I
- —
- Monthly cashflow
- —
- DSCR
- —
- Eligible?
- —
No personal income docs; deal must DSCR.
Hard money
10% down · 12.0% · 12mo
- Down + closing
- —
- Monthly P&I
- —
- Monthly cashflow
- —
- DSCR
- —
- Eligible?
- —
Short-term bridge; refi at stabilization.
Listing history 10 events
-
2026-06-17days on market $269,900 Active 11 DOM
-
2026-06-16days on market $269,900 Active 10 DOM
-
2026-06-15days on market $269,900 Active 9 DOM
-
2026-06-14days on market $269,900 Active 7 DOM
-
2026-06-13days on market $269,900 Active 6 DOM
-
2026-06-10days on market $269,900 Active 4 DOM
-
2026-06-09days on market $269,900 Active 3 DOM
-
2026-06-08days on market $269,900 Active 2 DOM
-
2026-06-07remarks 699-char remark
-
2026-06-07$269,900 Active 1 DOM
ⓘ Source: listings_history table (triggers on properties + properties_extension) + one-shot
backfill from property_details.listing_events for pre-trigger history.
Tax reassessment forecast NY · Partial reset (capped growth)
- Current annual tax
- $8,675 · $723/mo
- Projected year-2 tax
- $8,675 · $723/mo
- Expected delta
- $0/yr ($0/mo · 0.0%)
ⓘ Screening estimate from a state-policy table — verify with the county assessor before closing.
Climate risk First Street
- Flood 4/10 Moderate FEMA zone X (unshaded) · 24% chance over 30 yrs
- Wildfire 4/10 Moderate
- Heat 3/10 Moderate 6 d/yr ≥95°F today · 13 d/yr by 30 yrs out
- Wind 4/10 Moderate 14% chance of damaging wind over 30 yrs
- Air quality 3/10 Moderate 2 unhealthy d/yr today · 3 by 30 yrs out
Nearby sold comps map
Loading sold comps map…
Walkable amenities ~0.75 mi
Loading nearby amenities…
Taxation est. · year 1
- Rental income
- $34,570
- − Mortgage interest
- −$15,119
- − Property taxes
- −$8,675
- − Insurance
- −$1,350
- − Repairs & maintenance
- −$2,766
- − Management
- −$2,766
- − Depreciation
- −$7,852
- Taxable loss
- −$3,955
- Est. tax savings @ 24.0%
- +$949
- After-tax cash flow
- $1,251/yr
For passive investors: Depreciation is non-cash, so a rental often shows a tax loss while cash-flowing — sheltering income. Rental losses are passive: they offset passive income freely, and up to $25,000/yr can offset ordinary (W-2) income if you actively participate and your MAGI is under $100k (phasing out to $0 by $150k); unused losses carry forward. On sale, claimed depreciation is recaptured at up to 25%, and gains may owe capital-gains tax (a 1031 exchange can defer both). Figures are a year-1 estimate at your 24.0% rate — not tax advice; consult a CPA.
Schools (NCES district)
- District
- Carmel Central School District
- NCES district ID
- 3606570
- Math proficiency
- 46% ▼ -15.00%
- Reading proficiency
- 63% ▲ 11.00%
- Median HH income
- $87,665
- Composite
- 50.05/100
- National rank
- #1914
- State rank
- #258 of 590 in NY
Livability — Shorehaven
No livability data for this city. (Only ~50 U.S. cities are tracked.)
Census & demographics
- Population (ZIP)
- 6,157
Population outlook (Dutchess County) Hauer SSP2
- Today (2025)
- 291,768 people
- By 2030
- 287,131 · -1.6%
- By 2040
- 274,881 · -5.8%
- By 2050
- 259,971 · -10.9%
- By 2075
- 235,366 · -19.3%
- By 2100
- 208,786 · -28.4%
Race, ethnicity, and origin ACS 2023
- Neighborhood character
- Majority White (63%)
- Race & ethnicity
- White 63% Hispanic / Latino 18% Black 17% Two or more races 9% Asian 1%
- Hispanic origin (detail)
- Puerto Rican 5% Cuban 2%
- Common ancestry
- Romanian 2% Iranian 1% Lithuanian 1%
- Foreign-born
- 8% · Canada, Jamaica, China
- Languages at home
- 89% English-only · Spanish 8% French/Haitian/Cajun 1% Tagalog/Filipino 1%
Political lean MEDSL · Dutchess
- 2024 margin
- Lean D (+5.4) · D 52.7% · R 47.3%
- 2008→2024 swing
- -3.2pp toward R · 2008: 8.6pp · 2024: 5.4pp
- All cycles
- 2024: D+5.4 2020: D+9.6 2016: R+1.1 2012: D+6.6 2008: D+8.6
Not yet ingested
- Civics
- —
Market trends
- HPI YoY
- ▼ -16.61%
- Current HPI
- 223.0403
- Rent YoY
- —
- Metro
- —
- State GDP YoY
- ▲ 2.60%
- F500 in state
- 92
Industry mix (Fortune 500 HQ in NY)
| Industry | F500 HQs | Revenue |
|---|---|---|
| Financial Services | 10 | $950B |
|
||
| Consumer Goods | 9 | $162B |
|
||
| Insurance | 4 | $225B |
|
||
| Telecommunications | 2 | $144B |
|
||
| Pharmaceuticals | 2 | $112B |
|
||
| Media / Entertainment | 2 | $69B |
|
||
Price history
+3.8% since first listed13 events — show timeline
- 2026-06-06 Listed $269,900 OneKey® MLS as Distributed by MLS Grid
- 2023-11-20 Relisted — OneKey® MLS as Distributed by MLS Grid
- 2023-10-30 Listing Removed — OneKey® MLS as Distributed by MLS Grid
- 2022-12-22 Price Changed $229,000 OneKey® MLS as Distributed by MLS Grid
- 2022-11-22 Listed $249,000 OneKey® MLS as Distributed by MLS Grid
- 2022-09-29 Listing Removed — OneKey® MLS as Distributed by MLS Grid
- 2022-08-31 Listed $299,999 OneKey® MLS as Distributed by MLS Grid
- 2021-02-28 Listing Removed — OneKey® MLS as Distributed by MLS Grid
- 2020-08-31 Listed $280,000 OneKey® MLS as Distributed by MLS Grid
- 2020-06-05 Listing Removed — OneKey® MLS as Distributed by MLS Grid
- 2019-09-05 Listed $259,900 OneKey® MLS as Distributed by MLS Grid
- 2006-11-30 Delisted — HGMLS
- 2006-05-04 Listed — HGMLS
Property tax history
+4.2%/yrLatest (2025): $8,675 · -0.0% YoY. Source: county tax records.
Cash-flow waterfall
monthlySold comps — $/sqft
last 12 mo · ≤1 miLoading sold comps…