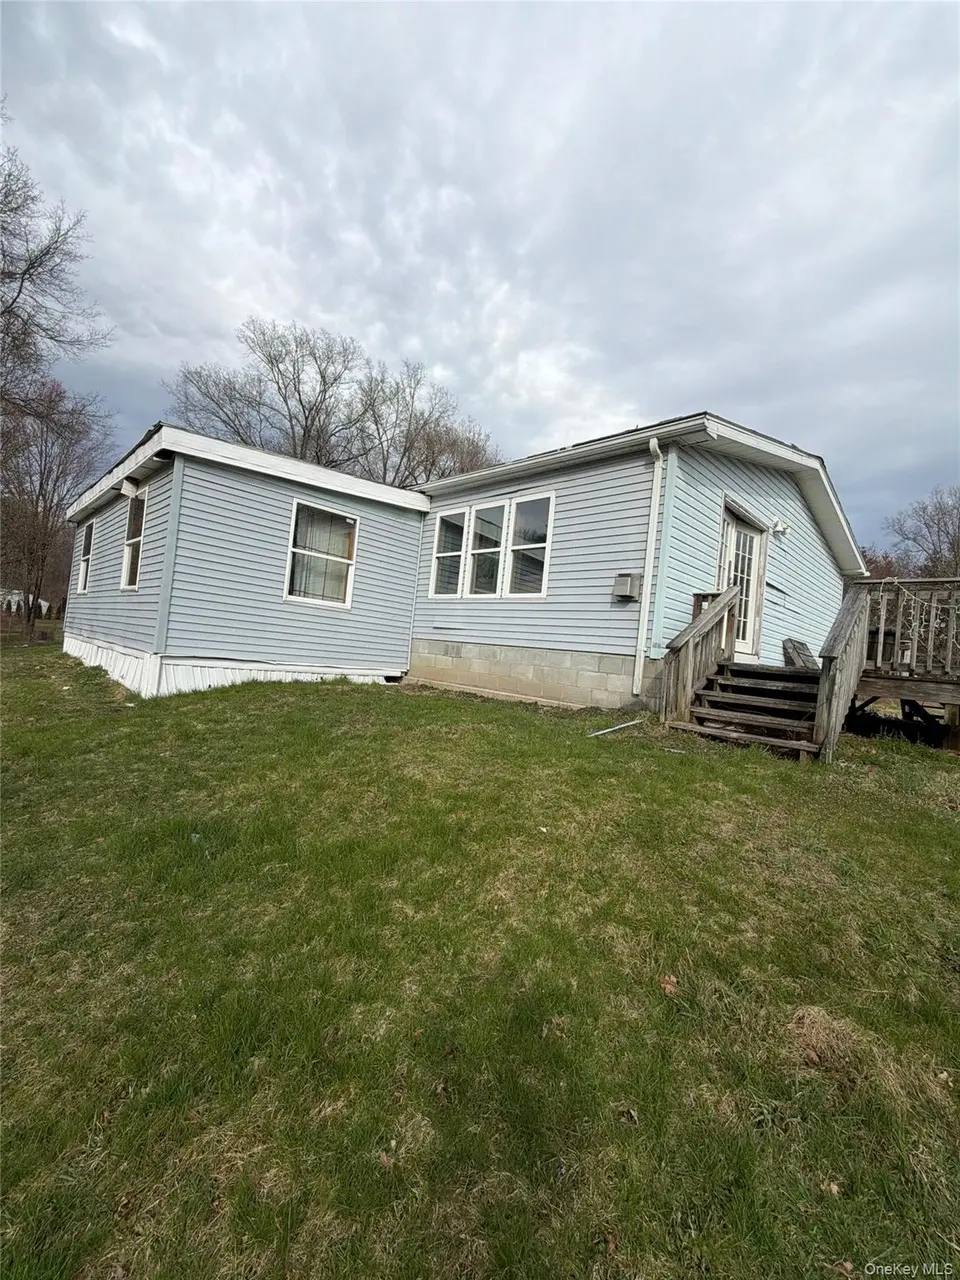
10 Spike Horn Rd
Palenville, NY 12477
$269,000D-
3 bd · 2.0 ba ·
1,880 sqft ·
Built 1993
· Manufactured
· Active
· 43 DOM
Cashflow @ list (25.0% down · 7.5%)
Estimated rent
$2,477/mo
Mortgage (P&I)
−$1,411
Tax + insurance
−$591
HOA
−$0
Vac / Maint / Mgmt
−$520
Net cashflow
$-44/mo
Annual
$-534/yr
Cap rate
6.09%
Cash-on-cash
-0.71%
DSCR
0.97
1% rule
0.92%
Cash to close
$75,320
Investor read
- This is a 3-bed/2.0-bath manufactured listed at $269k.
- At list price, monthly cash flow is $-44 ($-534/yr) — negative.
- To cash-flow at today's rent, offer at most $261k (2.9% below list).
- To meet the 1% rule (rent ≥ 1% of price), the offer needs to be $248k (7.9% below list).
- It's been on market 43 days — a 3% lower offer ($261k) is reasonable based on typical stale-listing flexibility.
- Recommended offer: $248k (7.9% below list) — sets the bar for 1% rule.
- Local home prices are declining (-3.0%/yr); year-one equity from $2k of loan paydown is wiped out by about $8k of value loss. Plan a longer hold.
- Location reads 55/100 on livability (#1,125 in NY) — a working-class tenant base; expect higher turnover. Strengths: crime A, housing A; Watch: amenities F, commute F, employment F.
- Saugerties Central School District (suburban): math 38% / reading 57% proficiency, ranked #419 of 590 in NY (top 71%) — families likely to look elsewhere, expect single-tenant / working-renter base with shorter leases.
- Market conditions: 173 active listings in the ZIP; solid renter incomes; 464 units permitted in Ulster County in 2024 (170 in 5+ unit buildings).
- Ulster County population projected at -14% by 2050 — secular population decline; favor cash flow + early exit over multi-decade hold.
- 2 sale attempts since 18y ago; this cycle's ask has dropped $30k (10%) from the opening price — seller is motivated, your offer sets the floor, not the list.
- Current owner paid $190k; 42% above their basis — modest negotiation headroom, anchor on the comps not their cost.
- Cap rate 6.1% vs local median 2.2% in Palenville — top-decile yield for the area; either an underpriced asset or a hidden risk that comps aren't pricing in. Stress-test before assuming the spread holds.
- This rent runs 37% of the median local income ($81k/yr) — at the standard rent-burdened threshold; future hikes will face affordability resistance.
Questions for listing agent
- What do current leases actually rent for vs. the listed asking? Can we see a recent rent roll and the last 12 months of T-12 income?
- It's been on market 43 days. Have you received any prior offers? Is the seller open to a 8% concession, seller financing, or rate buy-down credit?
- Is there a deadline driving the sale (1031 exchange, divorce, estate, relocation)? That informs how much negotiation room exists.
- The area grade is low — what's the realistic commute time and amenity access for the typical tenant pool here? Any planned neighborhood developments (good or bad) we should know about?
- What's the average days-on-market for RENTAL listings here right now (not sales)? A rising rental-DOM trend means longer vacancies and softer asking-rent achievability than the comps imply.
- What's the recent tenant-quality profile in this submarket — average credit score on applications, eviction rate, late-payment / NSF rate, and stable-employment percentage? A property-management company in the area should have these aggregated.
- How much new for-sale + rental construction is in the pipeline within 1–3 miles? Heavy new supply typically softens prices + rents 12–24 months out; constrained supply supports both.
CashFlowRE · CFR-RVW3KE7KZC2697
· Data 1 week ago
cashflowre.app · 2026-05-29