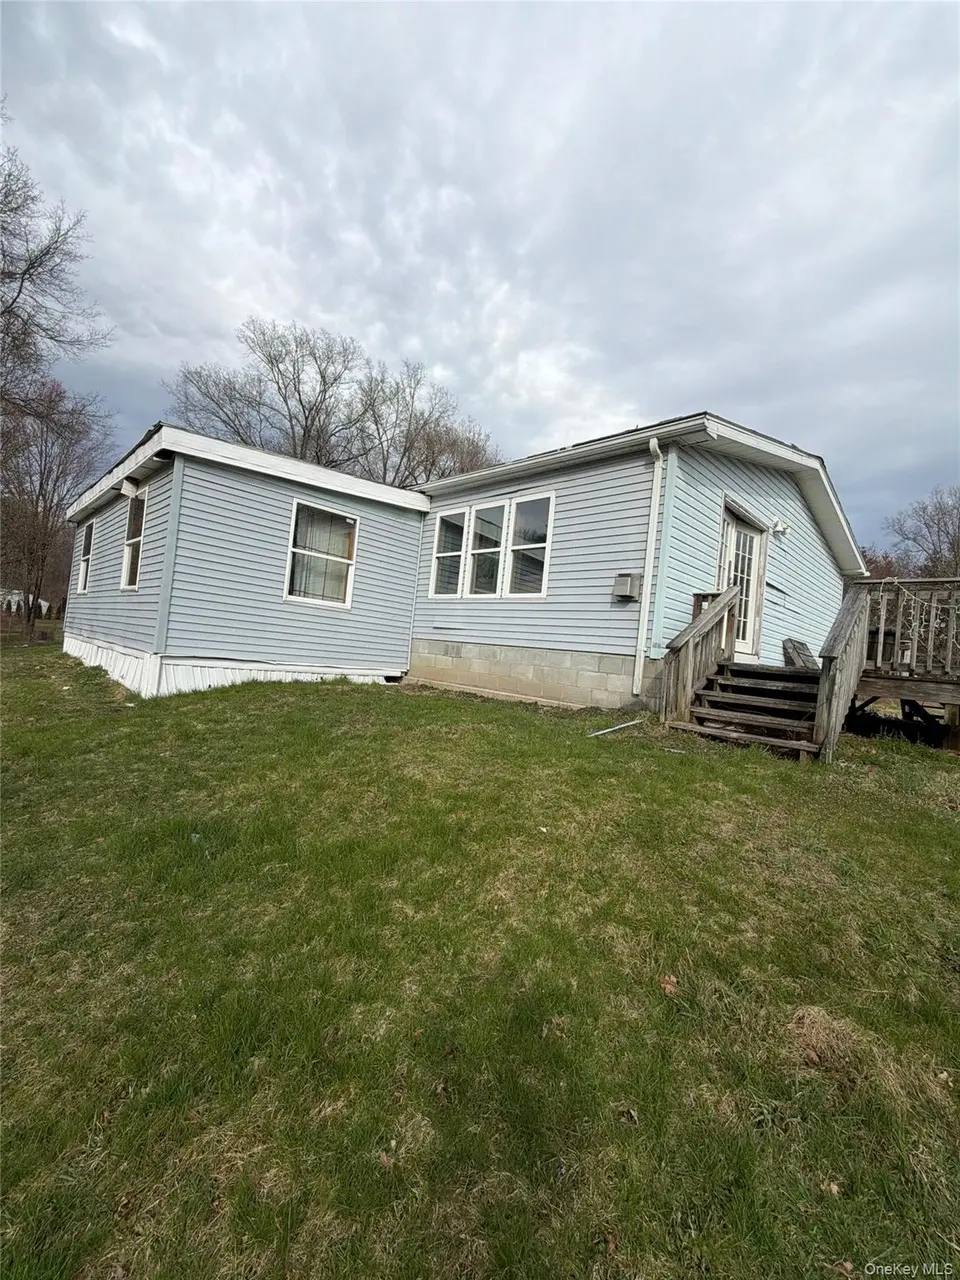
10 Spike Horn Rd · Palenville, NY
Flood risk 1/10 · Minimal
- FEMA flood zone
- X (unshaded)
- Chance of flooding over 30 yrs
- 0.0%
- Est. flood insurance / yr
- $507 – $1,088
Fire risk 4/10 · Minor
- Est. fire insurance / yr
- $691 – $1,283
Heat risk 3/10 · Minor
- Hot days now (above 98°F)
- 7 days/yr
- Hot days in 30 yrs
- 16 days/yr
Wind risk 3/10 · Minor
- Chance of severe wind over 30 yrs
- 6.0%
Air-quality risk 2/10 · Minimal
- Unhealthy air days now
- 0 days/yr
- Unhealthy air days in 30 yrs
- 1 days/yr
Risk factors via First Street. Map © Google.
Why this score? — see what drove the D- grade
The composite is a weighted blend of 9 inputs, each scored 0–100. Each bar is that input's sub-score; the figure is the points it added to the 100-point composite (weight × sub-score).
- Cash flow +12.4/30.0
- ARV discount +7.5/15.0
- 1% rule +4.2/10.0
- Schools +4.1/10.0
- DSCR +3.7/10.0
- Livability +2.8/5.0
- Rent growth +2.5/5.0
- Condition / age +2.5/5.0
- Appreciation +0.0/10.0
$269,000
🖨 Deal sheet 📄 Offer letter ✓ Due diligence
Listing remarks MLS
This home offers a lot of room with a great large kitchen plus plenty of cabinets and counter space. Nice size master w/master bath and walkin closet. French doors in LR lead to spacious deck and attached 20x40 abv. ground pool. Also,gas fireplace in LR. An addition has been added to the front of this home which is being used as bedrooms. Plenty of land for enjoyment and is on a dead end road.
Key facts
- Functional layout
- 2.14 acre lot
- Pool
Tags
Property features AI
Exterior
- Parking: Driveway (no carport)
- Utilities: Septic tank; Propane
- Home design: Single family residence
- Construction: Construction: aluminum siding and vinyl siding
- Exterior features: Aluminum and vinyl siding; Private pool; Not waterfront
Interior
- Kitchen: No appliances included
- Bedrooms: Bedroom count not specified
- Bathrooms: 2 full bathrooms
- Heating & cooling: Central air conditioning; Oil heating
- Interior features: Eat-in kitchen; 8 total rooms
- Laundry & utility: Basement not present
Neighborhood map
What this means for you Summary
Snapshot
- This is a 3-bed/2.0-bath manufactured listed at $269k.
Deal economics
- At list price, monthly cash flow is $-44 ($-534/yr) — negative.
- To cash-flow at today's rent, offer at most $261k (2.9% below list).
- To meet the 1% rule (rent ≥ 1% of price), the offer needs to be $248k (7.9% below list).
- Recommended offer: $248k (7.9% below list) — sets the bar for 1% rule.
- Cap rate 6.1% vs local median 2.2% in Palenville — top-decile yield for the area; either an underpriced asset or a hidden risk that comps aren't pricing in. Stress-test before assuming the spread holds.
Location & tenants
- Location reads 55/100 on livability (#1,125 in NY) — a working-class tenant base; expect higher turnover. Strengths: crime A, housing A; Watch: amenities F, commute F, employment F.
- Saugerties Central School District (suburban): math 38% / reading 57% proficiency, ranked #419 of 590 in NY (top 71%) — families likely to look elsewhere, expect single-tenant / working-renter base with shorter leases.
- Market conditions: 173 active listings in the ZIP; solid renter incomes; 464 units permitted in Ulster County in 2024 (170 in 5+ unit buildings).
- This rent runs 37% of the median local income ($81k/yr) — at the standard rent-burdened threshold; future hikes will face affordability resistance.
Forward outlook
- Local home prices are declining (-3.0%/yr); year-one equity from $2k of loan paydown is wiped out by about $8k of value loss. Plan a longer hold.
- Ulster County population projected at -14% by 2050 — secular population decline; favor cash flow + early exit over multi-decade hold.
Negotiation context
- It's been on market 43 days — a 3% lower offer ($261k) is reasonable based on typical stale-listing flexibility.
- 2 sale attempts since 18y ago; this cycle's ask has dropped $30k (10%) from the opening price — seller is motivated, your offer sets the floor, not the list.
- Current owner paid $190k; 42% above their basis — modest negotiation headroom, anchor on the comps not their cost.
Questions for the listing agent
- What do current leases actually rent for vs. the listed asking? Can we see a recent rent roll and the last 12 months of T-12 income?
- It's been on market 43 days. Have you received any prior offers? Is the seller open to a 8% concession, seller financing, or rate buy-down credit?
- Is there a deadline driving the sale (1031 exchange, divorce, estate, relocation)? That informs how much negotiation room exists.
- The area grade is low — what's the realistic commute time and amenity access for the typical tenant pool here? Any planned neighborhood developments (good or bad) we should know about?
- What's the average days-on-market for RENTAL listings here right now (not sales)? A rising rental-DOM trend means longer vacancies and softer asking-rent achievability than the comps imply.
- What's the recent tenant-quality profile in this submarket — average credit score on applications, eviction rate, late-payment / NSF rate, and stable-employment percentage? A property-management company in the area should have these aggregated.
- How much new for-sale + rental construction is in the pipeline within 1–3 miles? Heavy new supply typically softens prices + rents 12–24 months out; constrained supply supports both.
Investment metrics
- 1% rule
- 0.92% ✗
- Cap rate
- 6.09%
- Cash-on-cash
- -0.71%
- DSCR
- 0.97
- GRM
- 9.0
CMA / ARV
No comps found within radius.
Projected returns pro-forma
-3.0% appreciation · 3.0% rent growth · sell at horizon
- IRR
- -17.4%
- Equity multiple
- 0.39×
- Total profit
- $-46,296
- Equity at exit
- $40,109
- IRR
- -9.3%
- Equity multiple
- 0.42×
- Total profit
- $-43,453
- Equity at exit
- $23,258
Cash invested: $75,320 (down + closing). Projections, not guarantees.
Landlord ↔ Tenant lean methodology
- Overall (STATE)
- 15 Strongly Tenant-Friendly
- State New York
- 15 Strongly Tenant-Friendly · D+10
- County
- — inherits STATE
- City
- — inherits STATE
ZIP-level market 12477
- Home prices YoY
- -18.1%
- Active inventory
- 173
- Price-to-rent
- 9.0×
Monthly cashflow live
- Estimated rent
- $2,477 medium interval (Pro) →
- Mortgage (P&I)
- −$1,411
- Tax from tax record
- −$479 /mo · $5,743/yr
- Insurance
- −$112
- HOA
- −$0
- Vacancy / Maint / Mgmt
- −$520
- Net cashflow
- $-44
Break-even live
UW: 25.0% down · 7.5% · 30yr · 1.5% tax · 5.0% vac · 8.0% maint · 8.0% mgmt
Financing live
Cash to close
- Down payment
- $67,250
- Closing costs
- $8,070
- Reserves months
- —
- Total cash needed
- —
Loan-product check · same deal, 3 products live
Conventional
25% down · 7.5% · 30yr
- Down + closing
- —
- Monthly P&I
- —
- Monthly cashflow
- —
- DSCR
- —
- Eligible?
- —
Personal DTI + credit; lowest rate.
DSCR
20% down · 8.5% · 30yr
- Down + closing
- —
- Monthly P&I
- —
- Monthly cashflow
- —
- DSCR
- —
- Eligible?
- —
No personal income docs; deal must DSCR.
Hard money
10% down · 12.0% · 12mo
- Down + closing
- —
- Monthly P&I
- —
- Monthly cashflow
- —
- DSCR
- —
- Eligible?
- —
Short-term bridge; refi at stabilization.
Listing history 15 events
-
2026-06-09days on market $269,000 Active 43 DOM
-
2026-06-08days on market $269,000 Active 42 DOM
-
2026-06-07days on market $269,000 Active 41 DOM
-
2026-06-05days on market $269,000 Active 38 DOM
-
2026-06-03days on market $269,000 Active 37 DOM
-
2026-06-02days on market $269,000 Active 36 DOM
-
2026-06-01days on market $269,000 Active 35 DOM
-
2026-05-31days on market $269,000 Active 34 DOM
-
2026-05-30days on market $269,000 Active 33 DOM
-
2026-05-07price $289,000 448-char remark
-
2026-04-27$299,000 Active 448-char remark
-
2008-11-25soldstatus $190,000
-
2008-11-19soldstatus $180,000 396-char remark
Show marketing remark (396 chars)
This home offers a lot of room with a great large kitchen plus plenty of cabinets and counter space. Nice size master w/master bath and walkin closet. French doors in LR lead to spacious deck and attached 20x40 abv. ground pool. Also,gas fireplace in LR. An addition has been added to the front of this home which is being used as bedrooms. Plenty of land for enjoyment and is on a dead end road.
-
2008-07-07$204,000 396-char remark
Show marketing remark (396 chars)
This home offers a lot of room with a great large kitchen plus plenty of cabinets and counter space. Nice size master w/master bath and walkin closet. French doors in LR lead to spacious deck and attached 20x40 abv. ground pool. Also,gas fireplace in LR. An addition has been added to the front of this home which is being used as bedrooms. Plenty of land for enjoyment and is on a dead end road.
-
1993-06-25soldstatus $30,000
ⓘ Source: listings_history table (triggers on properties + properties_extension) + one-shot
backfill from property_details.listing_events for pre-trigger history.
Tax reassessment forecast NY · Partial reset (capped growth)
- Current annual tax
- $5,743 · $479/mo
- Projected year-2 tax
- $5,743 · $479/mo
- Expected delta
- $0/yr ($0/mo · 0.0%)
ⓘ Screening estimate from a state-policy table — verify with the county assessor before closing.
Climate risk First Street
- Flood 1/10 Low FEMA zone X (unshaded) · 0% chance over 30 yrs
- Wildfire 4/10 Moderate
- Heat 3/10 Moderate 7 d/yr ≥98°F today · 16 d/yr by 30 yrs out
- Wind 3/10 Moderate 6% chance of damaging wind over 30 yrs
- Air quality 2/10 Low 0 unhealthy d/yr today · 1 by 30 yrs out
Nearby sold comps map
Loading sold comps map…
Walkable amenities ~0.75 mi
Loading nearby amenities…
Taxation est. · year 1
- Rental income
- $29,724
- − Mortgage interest
- −$15,068
- − Property taxes
- −$5,743
- − Insurance
- −$1,345
- − Repairs & maintenance
- −$2,378
- − Management
- −$2,378
- − Depreciation
- −$7,825
- Taxable loss
- −$5,013
- Est. tax savings @ 24.0%
- +$1,203
- After-tax cash flow
- $670/yr
For passive investors: Depreciation is non-cash, so a rental often shows a tax loss while cash-flowing — sheltering income. Rental losses are passive: they offset passive income freely, and up to $25,000/yr can offset ordinary (W-2) income if you actively participate and your MAGI is under $100k (phasing out to $0 by $150k); unused losses carry forward. On sale, claimed depreciation is recaptured at up to 25%, and gains may owe capital-gains tax (a 1031 exchange can defer both). Figures are a year-1 estimate at your 24.0% rate — not tax advice; consult a CPA.
Schools (NCES district)
- District
- Saugerties Central School District
- NCES district ID
- 3625800
- Math proficiency
- 38% ▼ -16.00%
- Reading proficiency
- 57% ▲ 8.00%
- Median HH income
- $56,897
- Composite
- 41.3/100
- National rank
- #3515
- State rank
- #419 of 590 in NY
Livability — Palenville
- Score
- 55/100
- State rank
- #1125
- US rank
- #23193
Category grades
Schools grade is shown separately in the Schools card above.
Census & demographics
- County
- Ulster County · 56,183 people
- Metro
- Kingston, NY
- Population (ZIP)
- 19,066
- Household income
- $80,861
- Rent vs Own
- Severe rent burden
- 725.0
Population outlook (Ulster County) Hauer SSP2
- Today (2025)
- 175,887 people
- By 2030
- 171,876 · -2.3%
- By 2040
- 161,771 · -8.0%
- By 2050
- 151,470 · -13.9%
- By 2075
- 133,023 · -24.4%
- By 2100
- 113,504 · -35.5%
Race, ethnicity, and origin ACS 2023
- Neighborhood character
- Predominantly White (82%)
- Race & ethnicity
- White 82% Two or more races 12% Hispanic / Latino 6% Black 1%
- Hispanic origin (detail)
- Puerto Rican 2% Cuban 1%
- Common ancestry
- Romanian 5% Iranian 4% Italian 3%
- Foreign-born
- 4% · Canada
- Languages at home
- 92% English-only · Spanish 4% Other Indo-European 1% German/W. Germanic 1%
Political lean MEDSL · Ulster
- 2024 margin
- D (+18.7) · D 59.3% · R 40.7%
- 2008→2024 swing
- -4.9pp toward R · 2008: 23.6pp · 2024: 18.7pp
- All cycles
- 2024: D+18.7 2020: D+20.9 2016: D+9.1 2012: D+21.9 2008: D+23.6
Not yet ingested
- Civics
- —
Market trends
- HPI YoY
- ▼ -72.47%
- Current HPI
- 327.9975
- Rent YoY
- —
- Metro
- Kingston, NY
- State GDP YoY
- ▲ 2.60%
- F500 in state
- 92
Industry mix (Fortune 500 HQ in NY)
| Industry | F500 HQs | Revenue |
|---|---|---|
| Financial Services | 10 | $950B |
|
||
| Consumer Goods | 9 | $162B |
|
||
| Insurance | 4 | $225B |
|
||
| Telecommunications | 2 | $144B |
|
||
| Pharmaceuticals | 2 | $112B |
|
||
| Media / Entertainment | 2 | $69B |
|
||
Price history
+796.7% since first listed7 events — show timeline
- 2026-05-25 Price Changed $269,000 OneKey® MLS as Distributed by MLS Grid
- 2026-05-07 Price Changed $289,000 OneKey® MLS as Distributed by MLS Grid
- 2026-04-27 Listed $299,000 OneKey® MLS as Distributed by MLS Grid
- 2008-11-25 Sold (Public Records) $190,000 Public Records
- 2008-11-19 Sold (MLS) $180,000 HVCRMLS
- 2008-07-07 Listed $204,000 HVCRMLS
- 1993-06-25 Sold (Public Records) $30,000 Public Records
Property tax history
+1.4%/yrLatest (2025): $5,743 · +0.4% YoY. Source: county tax records.
Cash-flow waterfall
monthlySold comps — $/sqft
last 12 mo · ≤1 miLoading sold comps…