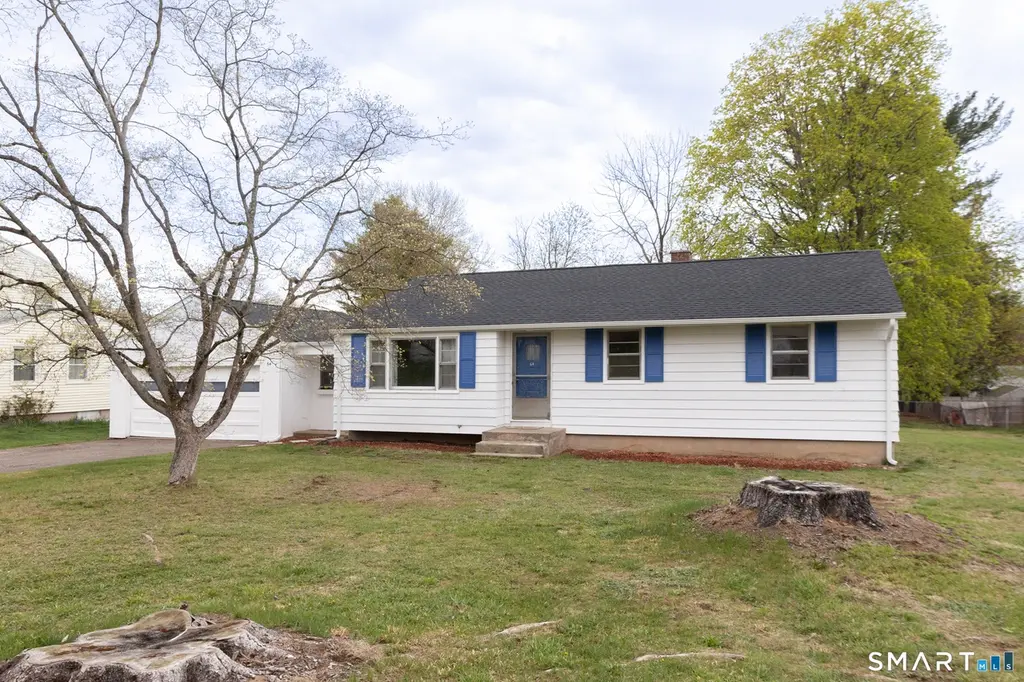
64 George Dr
Rockville, CT 06066
$275,000D
3 bd · 1.5 ba ·
1,078 sqft ·
Built 1962
· SingleFamily
· Under Contract
· 4 DOM
Cashflow @ list (25.0% down · 7.5%)
Estimated rent
$2,146/mo
Mortgage (P&I)
−$1,442
Tax + insurance
−$460
HOA
−$0
Vac / Maint / Mgmt
−$451
Net cashflow
$-207/mo
Annual
$-2,481/yr
Cap rate
5.39%
Cash-on-cash
-3.22%
DSCR
0.86
1% rule
0.78%
Cash to close
$77,000
Investor read
- This is a 3-bed/1.5-bath single-family listed at $275k.
- At list price, monthly cash flow is $-207 ($-2k/yr) — negative.
- To cash-flow at today's rent, offer at most $238k (13.3% below list).
- To meet the 1% rule (rent ≥ 1% of price), the offer needs to be $215k (22.0% below list).
- Only 4 days on market — expect competitive offers; lowballing is unlikely to land.
- Recommended offer: $215k (22.0% below list) — sets the bar for 1% rule.
- Local home prices are declining (-3.0%/yr); year-one equity from $2k of loan paydown is wiped out by about $8k of value loss. Plan a longer hold.
- Location reads 73/100 on livability (#73 in CT) — a middle-class / working-renter tenant base. Strengths: health & safety A+, cost of living A, crime B+; Watch: employment D, amenities F, commute F.
- Vernon School District (suburban): math 34% / reading 48% proficiency, ranked #97 of 153 in CT (top 63%) — families likely to look elsewhere, expect single-tenant / working-renter base with shorter leases.
- Zoned schools: Skinner Road School (math 32% / reading 47%, grade F, #298 of 553 statewide, top 56%, 321 students, 52% FRL); Vernon Center Middle School (math 29% / reading 45%, grade F, #116 of 175 statewide, top 67%, 678 students, 60% FRL); Rockville High School (math 22% / reading 52%, grade F, #112 of 194 statewide, top 60%, 932 students, 48% FRL) — zoned schools average 53% FRL vs 35% district-wide (18 pts higher); higher-poverty schools than district average — tighter screening recommended.
- Market conditions: Rents rising fast (+4.7%/yr); 83 active listings in the ZIP; 7 comparable units currently listed for rent nearby; rentals leasing fast (median 4d on market — plan ~1-2 weeks tenant-placement turnaround); solid renter incomes; 1,867 units permitted in Capitol Planning Region in 2024 (1,399 in 5+ unit buildings).
- Climate carrying-cost: major wind risk, 27% chance of damaging wind over 30y — expect insurance premiums to compound above CPI over the hold.
- Cap rate 5.4% vs local median 3.5% in Rockville — top-decile yield for the area; either an underpriced asset or a hidden risk that comps aren't pricing in. Stress-test before assuming the spread holds.
- This rent runs 30% of the median local income ($85k/yr) — at the standard rent-burdened threshold; future hikes will face affordability resistance.
Questions for listing agent
- What do current leases actually rent for vs. the listed asking? Can we see a recent rent roll and the last 12 months of T-12 income?
- Built in 1962 — when were the roof, HVAC, electrical panel, plumbing, and water heater last replaced?
- Is there a deadline driving the sale (1031 exchange, divorce, estate, relocation)? That informs how much negotiation room exists.
- The area grade is low — what's the realistic commute time and amenity access for the typical tenant pool here? Any planned neighborhood developments (good or bad) we should know about?
- What's the average days-on-market for RENTAL listings here right now (not sales)? A rising rental-DOM trend means longer vacancies and softer asking-rent achievability than the comps imply.
- What's the recent tenant-quality profile in this submarket — average credit score on applications, eviction rate, late-payment / NSF rate, and stable-employment percentage? A property-management company in the area should have these aggregated.
- How much new for-sale + rental construction is in the pipeline within 1–3 miles? Heavy new supply typically softens prices + rents 12–24 months out; constrained supply supports both.
CashFlowRE · CFR-RWRVZT85YPA3FS
· Data 3 weeks ago
cashflowre.app · 2026-05-29