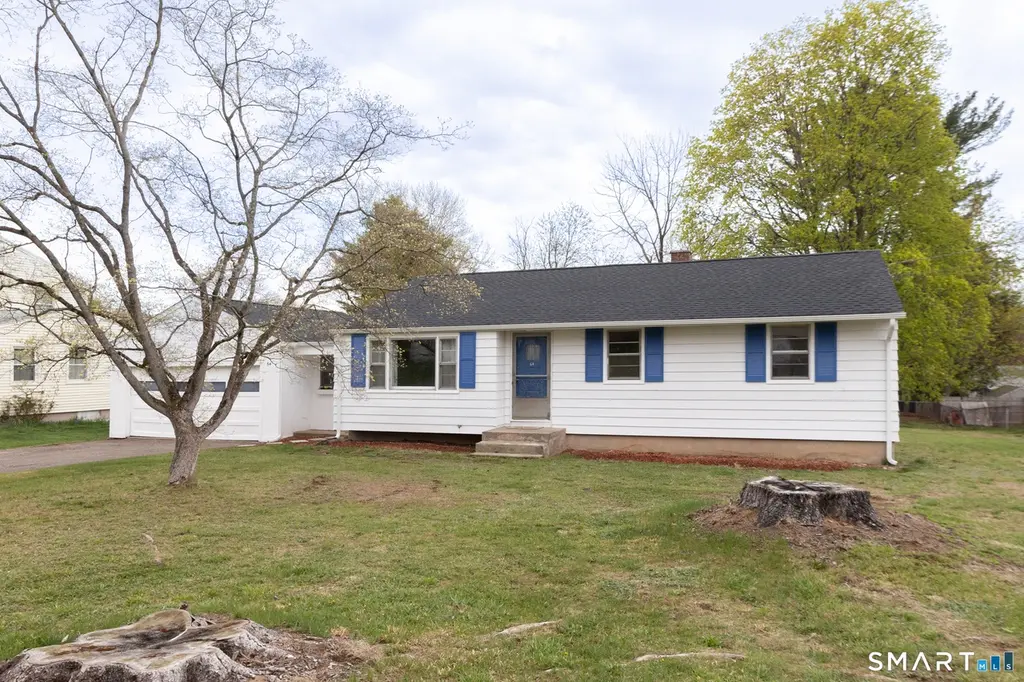
64 George Dr · Rockville, CT
Flood risk 1/10 · Minimal
- FEMA flood zone
- X
- Chance of flooding over 30 yrs
- 0.0%
- Est. flood insurance / yr
- $473 – $860
Fire risk 1/10 · Minimal
- Est. fire insurance / yr
- $829 – $1,539
Heat risk 4/10 · Minor
- Hot days now (above 95°F)
- 7 days/yr
- Hot days in 30 yrs
- 16 days/yr
Wind risk 6/10 · Moderate
- Chance of severe wind over 30 yrs
- 27.0%
Air-quality risk 3/10 · Minor
- Unhealthy air days now
- 3 days/yr
- Unhealthy air days in 30 yrs
- 4 days/yr
Risk factors via First Street. Map © Google.
Why this score? — see what drove the D grade
The composite is a weighted blend of 9 inputs, each scored 0–100. Each bar is that input's sub-score; the figure is the points it added to the 100-point composite (weight × sub-score).
- ARV discount +15.0/15.0
- Cash flow +9.2/30.0
- Rent growth +3.7/5.0
- Livability +3.7/5.0
- Schools +3.6/10.0
- 1% rule +2.8/10.0
- DSCR +2.6/10.0
- Condition / age +2.5/5.0
- Appreciation +0.0/10.0
$275,000
🖨 Deal sheet (PDF) 📄 Offer letter ✓ Due diligence
Listing remarks
This is the kind of home you walk into and immediately see the possibilities. With 3 bedrooms and 1.5 baths, it's easy to imagine adding your own style and making it truly yours over time. Well cared for and full of potential, it offers solid construction and the kind of layout that just makes sense. Hardwood floors run throughout the bedrooms, with even more waiting to be uncovered beneath the existing carpet. The primary bedroom includes its own attached half bath for added convenience, while both bathrooms have newer vanities. The spacious living room is filled with natural light thanks to an oversized front window, creating a warm and welcoming place to gather. Just off the mudroom, a s
Key facts
- 0.41 acre lot
- 2 garage spots
- Built 1962
Property features AI
Exterior
- Parking: Attached garage with space for 2 cars
- Utilities: Public water connected; Public sewer connected; Oil fuel tank located in the basement
- Home design: Single-family home; White exterior
- Construction: Frame construction; Aluminum vertical siding; Asphalt shingle roof; Concrete foundation; Built with a basement
- Exterior features: Level, cleared lot; Gutters
Interior
- Kitchen: Cooktop; Wall oven; Microwave; Refrigerator; Dishwasher
- Bedrooms: Three bedrooms
- Bathrooms: One full bathroom; One half bathroom
- Heating & cooling: Hot water heating (oil-fired); Tankless domestic hot water; Window unit cooling
- Interior features: Five total rooms; Full, unfinished basement with concrete floor, interior access and hatchway access for storage; Attic with hatch access; Window air conditioning unit
- Laundry & utility: Washer and dryer included; Laundry located on the main level in an unheated breezeway
Neighborhood map
What this means for you Summary
Snapshot
- This is a 3-bed/1.5-bath single-family listed at $275k.
Deal economics
- At list price, monthly cash flow is $-207 ($-2k/yr) — negative.
- To cash-flow at today's rent, offer at most $238k (13.3% below list).
- To meet the 1% rule (rent ≥ 1% of price), the offer needs to be $215k (22.0% below list).
- Recommended offer: $215k (22.0% below list) — sets the bar for 1% rule.
- Cap rate 5.4% vs local median 3.5% in Rockville — top-decile yield for the area; either an underpriced asset or a hidden risk that comps aren't pricing in. Stress-test before assuming the spread holds.
Location & tenants
- Location reads 73/100 on livability (#73 in CT) — a middle-class / working-renter tenant base. Strengths: health & safety A+, cost of living A, crime B+; Watch: employment D, amenities F, commute F.
- Vernon School District (suburban): math 34% / reading 48% proficiency, ranked #97 of 153 in CT (top 63%) — families likely to look elsewhere, expect single-tenant / working-renter base with shorter leases.
- Zoned schools: Skinner Road School (math 32% / reading 47%, grade F, #298 of 553 statewide, top 56%, 321 students, 52% FRL); Vernon Center Middle School (math 29% / reading 45%, grade F, #116 of 175 statewide, top 67%, 678 students, 60% FRL); Rockville High School (math 22% / reading 52%, grade F, #112 of 194 statewide, top 60%, 932 students, 48% FRL) — zoned schools average 53% FRL vs 35% district-wide (18 pts higher); higher-poverty schools than district average — tighter screening recommended.
- Market conditions: Rents rising fast (+4.7%/yr); 83 active listings in the ZIP; 7 comparable units currently listed for rent nearby; rentals leasing fast (median 4d on market — plan ~1-2 weeks tenant-placement turnaround); solid renter incomes; 1,867 units permitted in Capitol Planning Region in 2024 (1,399 in 5+ unit buildings).
- This rent runs 30% of the median local income ($85k/yr) — at the standard rent-burdened threshold; future hikes will face affordability resistance.
Forward outlook
- Local home prices are declining (-3.0%/yr); year-one equity from $2k of loan paydown is wiped out by about $8k of value loss. Plan a longer hold.
Negotiation context
- Only 4 days on market — expect competitive offers; lowballing is unlikely to land.
Risks & watch-outs
- Climate carrying-cost: major wind risk, 27% chance of damaging wind over 30y — expect insurance premiums to compound above CPI over the hold.
Questions for the listing agent
- What do current leases actually rent for vs. the listed asking? Can we see a recent rent roll and the last 12 months of T-12 income?
- Built in 1962 — when were the roof, HVAC, electrical panel, plumbing, and water heater last replaced?
- Is there a deadline driving the sale (1031 exchange, divorce, estate, relocation)? That informs how much negotiation room exists.
- The area grade is low — what's the realistic commute time and amenity access for the typical tenant pool here? Any planned neighborhood developments (good or bad) we should know about?
- What's the average days-on-market for RENTAL listings here right now (not sales)? A rising rental-DOM trend means longer vacancies and softer asking-rent achievability than the comps imply.
- What's the recent tenant-quality profile in this submarket — average credit score on applications, eviction rate, late-payment / NSF rate, and stable-employment percentage? A property-management company in the area should have these aggregated.
- How much new for-sale + rental construction is in the pipeline within 1–3 miles? Heavy new supply typically softens prices + rents 12–24 months out; constrained supply supports both.
Investment metrics
- 1% rule
- 0.78% ✗
- Cap rate
- 5.39%
- Cash-on-cash
- -3.22%
- DSCR
- 0.86
- GRM
- 10.7
CMA / ARV
- ARV (median comp)
- $338,653
- List price
- $275,000
- Delta
- -18.80%
- Verdict
- UNDERPRICED
- Comps
- 20 within 1.0 mi
Show comp detail 7 sales within ~0.75 mi
| Address | Dist | Beds/Ba | Sqft | Sold | Price | $/sf | Match |
|---|---|---|---|---|---|---|---|
| 64 George Dr | 0.00mi | 3/1.5 | 1,078 (0%) | 1mo | $337,000 | $313 | 99 |
| 8 Gem Dr | 0.38mi | 3/1.0 | 1,188 (+10%) | 2mo | $365,000 | $307 | 62 |
| 191 Windsorville Rd | 0.41mi | 3/2.0 | 1,152 (+7%) | 15mo | $375,000 | $326 | 55 |
| 18 Neill Rd | 0.64mi | 3/1.0 | 1,008 (-6%) | 24mo | $330,000 | $327 | 37 |
| 31 Wilson Ln | 0.68mi | 3/1.0 | 1,008 (-6%) | 22mo | $290,000 | $288 | 37 |
| 31 Barbara Rd | 0.53mi | 2/1.0 (-1) | 960 (-11%) | 16mo | $325,000 | $339 | 37 |
| 47 Wilson Ln | 0.75mi | 3/2.0 | 1,208 (+12%) | 23mo | $380,000 | $315 | 24 |
Match score weights: distance 35% · size 25% · config 20% · recency 20%. Top-matched comps best support the ARV.
Projected returns pro-forma
-3.0% appreciation · 4.73% rent growth · sell at horizon
- IRR
- -19.8%
- Equity multiple
- 0.30×
- Total profit
- $-53,895
- Equity at exit
- $41,003
- IRR
- -9.3%
- Equity multiple
- 0.38×
- Total profit
- $-47,594
- Equity at exit
- $23,777
Cash invested: $77,000 (down + closing). Projections, not guarantees.
Landlord ↔ Tenant lean methodology
- Overall (STATE)
- 27 Tenant-Leaning
- State Connecticut
- 27 Tenant-Leaning · D+7
- County
- — inherits STATE
- City
- — inherits STATE
ZIP-level market 06066
- Rents YoY
- 4.7%
- Active inventory
- 83
- Price-to-rent
- 10.7×
Monthly cashflow live
- Estimated rent
- $2,146 high interval (Pro) →
- Mortgage (P&I)
- −$1,442
- Tax from tax record
- −$346 /mo · $4,147/yr
- Insurance
- −$115
- HOA
- −$0
- Vacancy / Maint / Mgmt
- −$451
- Net cashflow
- $-207
Break-even live
Sensitivity live
| Price | -10% $-51 | -5% $-129 | +0% $-207 | +5% $-285 | +10% $-362 |
|---|---|---|---|---|---|
| Rent | -10% $-376 | -5% $-292 | +0% $-207 | +5% $-122 | +10% $-37 |
| Rate | -1.0pp $-68 | -0.5pp $-137 | base $-207 | +0.5pp $-278 | +1.0pp $-350 |
UW: 25.0% down · 7.5% · 30yr · 1.5% tax · 5.0% vac · 8.0% maint · 8.0% mgmt
Financing live
Cash to close
- Down payment
- $68,750
- Closing costs
- $8,250
- Reserves months
- —
- Total cash needed
- —
Loan-product check · same deal, 3 products live
Conventional
25% down · 7.5% · 30yr
- Down + closing
- —
- Monthly P&I
- —
- Monthly cashflow
- —
- DSCR
- —
- Eligible?
- —
Personal DTI + credit; lowest rate.
DSCR
20% down · 8.5% · 30yr
- Down + closing
- —
- Monthly P&I
- —
- Monthly cashflow
- —
- DSCR
- —
- Eligible?
- —
No personal income docs; deal must DSCR.
Hard money
10% down · 12.0% · 12mo
- Down + closing
- —
- Monthly P&I
- —
- Monthly cashflow
- —
- DSCR
- —
- Eligible?
- —
Short-term bridge; refi at stabilization.
Rent comps 7 comps
| Address | Beds | Baths | Sqft | Rent | $/sqft | DOM | Units | Dist |
|---|---|---|---|---|---|---|---|---|
| 655 Talcottville Rd #89 Vernon, CT | 2.0 | 1.5 | 1250 | $2,000 | $1.60 | 5d | 1 | 0.41mi |
| 60 Old Town Rd #194 Vernon, CT | 2.0 | 1.5 | 1292 | $1,950 | $1.51 | 3d | 1 | 0.70mi |
| 53 Franklin St Unit 2 Vernon, CT | 3.0 | 1.0 | 1120 | $2,200 | $1.96 | 3d | 1 | 0.89mi |
| 17 Regan St Vernon, CT | 1.0–2.0 | 1.0 | 762 | $1,700 | $2.23 | 3d | 1 | 1.22mi |
| 2 Eastview Dr Unit 1 Vernon, CT | 3.0 | 1.5 | 1480 | $2,550 | $1.72 | 45d | 1 | 1.36mi |
| 40 West St Vernon, CT | 2.0 | 1.0 | 735 | $1,800 | $2.45 | 3d | 1 | 1.36mi |
| 2 Eastview Dr Vernon, CT | 3.0 | 2.5 | 1480 | $2,550 | $1.72 | 45d | 1 | 1.40mi |
Listing history 3 events
-
2026-05-03status Under Contract 1141-char remark
-
2026-04-30$275,000 Active 1141-char remark
-
2026-04-23historical $275,000 1141-char remark
ⓘ Source: listings_history table (triggers on properties + properties_extension) + one-shot
backfill from property_details.listing_events for pre-trigger history.
Tax reassessment forecast CT · Partial reset (capped growth)
- Current annual tax
- $4,147 · $346/mo
- Projected year-2 tax
- $5,016 · $418/mo
- Expected delta
- +$869/yr (+$72/mo · 21.0%)
ⓘ Screening estimate from a state-policy table — verify with the county assessor before closing.
Climate risk First Street
- Flood 1/10 Low FEMA zone X · 0% chance over 30 yrs
- Wildfire 1/10 Low
- Heat 4/10 Moderate 7 d/yr ≥95°F today · 16 d/yr by 30 yrs out
- Wind 6/10 Major 27% chance of damaging wind over 30 yrs
- Air quality 3/10 Moderate 3 unhealthy d/yr today · 4 by 30 yrs out
Nearby sold comps map
Loading sold comps map…
Walkable amenities ~0.75 mi
Loading nearby amenities…
Taxation est. · year 1
- Rental income
- $25,755
- − Mortgage interest
- −$15,404
- − Property taxes
- −$4,147
- − Insurance
- −$1,375
- − Repairs & maintenance
- −$2,060
- − Management
- −$2,060
- − Depreciation
- −$8,000
- Taxable loss
- −$7,292
- Est. tax savings @ 24.0%
- +$1,750
- After-tax cash flow
- $-731/yr
For passive investors: Depreciation is non-cash, so a rental often shows a tax loss while cash-flowing — sheltering income. Rental losses are passive: they offset passive income freely, and up to $25,000/yr can offset ordinary (W-2) income if you actively participate and your MAGI is under $100k (phasing out to $0 by $150k); unused losses carry forward. On sale, claimed depreciation is recaptured at up to 25%, and gains may owe capital-gains tax (a 1031 exchange can defer both). Figures are a year-1 estimate at your 24.0% rate — not tax advice; consult a CPA.
Schools (NCES district)
- District
- Vernon School District
- NCES district ID
- 0904680
- Math proficiency
- 34% ▼ -11.00%
- Reading proficiency
- 48% ▼ -6.00%
- Median HH income
- $60,342
- Composite
- 36.26/100
- National rank
- #4704
- State rank
- #97 of 153 in CT
Livability — Rockville
- Score
- 73/100
- State rank
- #73
- US rank
- #5355
Category grades
Schools grade is shown separately in the Schools card above.
Census & demographics
- County
- Tolland County · 46,815 people
- Metro
- Hartford-East Hartford-Middletown, CT
- Population (ZIP)
- 30,577
- Household income
- $85,356
- Rent vs Own
- Severe rent burden
- 1140.0
Population outlook (Capitol County) Hauer SSP2
- By 2040
- 1,063,519
Race, ethnicity, and origin ACS 2023
- Neighborhood character
- Predominantly White (71%)
- Race & ethnicity
- White 71% Hispanic / Latino 12% Two or more races 7% Asian 6% Black 5%
- Hispanic origin (detail)
- Mexican 1% Puerto Rican 9%
- Common ancestry
- Lithuanian 8% Romanian 7% Slovak 2%
- Foreign-born
- 11% · Canada, China, South Korea
- Languages at home
- 84% English-only · Spanish 6% Other Indo-European 5% Russian/Polish/Slavic 1%
Political lean MEDSL · Capitol
- 2024 margin
- Strong D (+21.9) · D 60.1% · R 38.2% · Other 1.7%
- All cycles
- 2024: D+21.9
Not yet ingested
- Civics
- —
Market trends
- HPI YoY
- ▼ -136.25%
- Current HPI
- 249.7888
- Rent YoY
- ▲ 4.73%
- Metro
- Hartford-East Hartford-Middletown, CT
- State GDP YoY
- ▲ 1.06%
- F500 in state
- 38
Industry mix (Fortune 500 HQ in CT)
| Industry | F500 HQs | Revenue |
|---|---|---|
| Industrial Machinery | 4 | $38B |
|
||
| Insurance | 3 | $71B |
|
||
| Financial Services | 2 | $25B |
|
||
| Transportation / Logistics | 2 | $18B |
|
||
| Healthcare | 1 | $247B |
|
||
| Telecommunications | 1 | $55B |
|
||
Price history
+22.5% since first listed4 events — show timeline
- 2026-05-29 Sold (MLS) $337,000 Smart MLS
- 2026-05-03 Pending — Smart MLS
- 2026-04-30 Listed $275,000 Smart MLS
- 2026-04-23 Coming Soon $275,000 Smart MLS
Property tax history
-0.3%/yrLatest (2023): $4,147 · +0.0% YoY. Source: county tax records.
Cash-flow waterfall
monthlySold comps — $/sqft
last 12 mo · ≤1 miLoading sold comps…