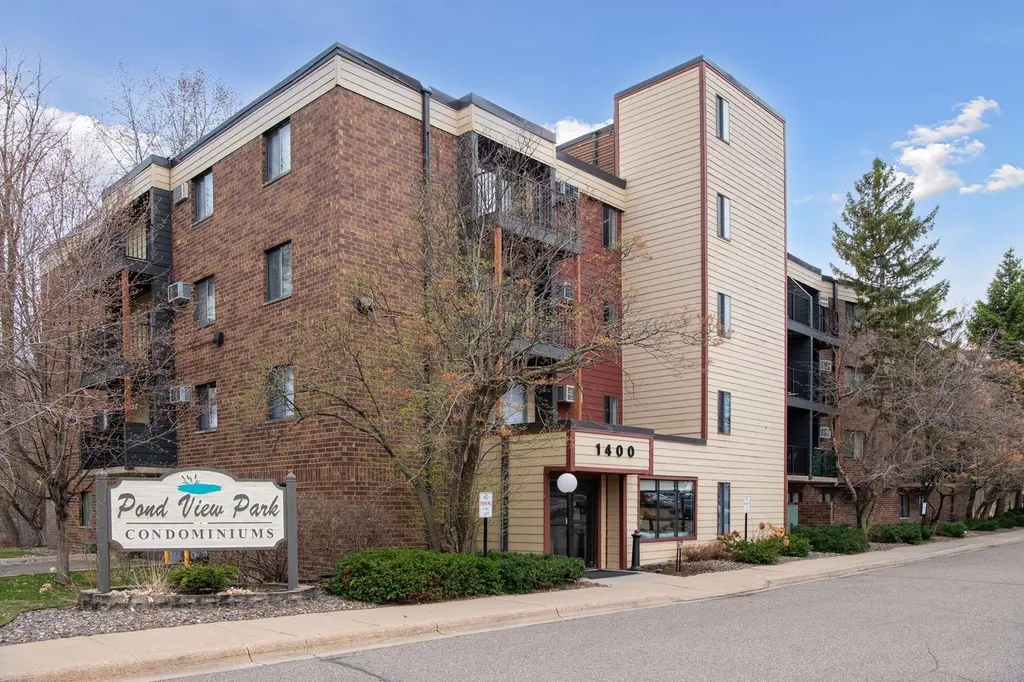
1400 Dakota Ave S #103
St. Louis Park, MN 55416
$133,000D
1 bd · 1.0 ba ·
663 sqft ·
Built 1983
· Condo
· Active
· 55 DOM
Cashflow @ list (25.0% down · 7.5%)
Estimated rent
$1,468/mo
Mortgage (P&I)
−$697
Tax + insurance
−$160
HOA
−$419
Vac / Maint / Mgmt
−$308
Net cashflow
$-117/mo
Annual
$-1,399/yr
Cap rate
5.24%
Cash-on-cash
-3.76%
DSCR
0.83
1% rule
1.10%
Cash to close
$37,240
Investor read
- This is a 1-bed/1.0-bath condo listed at $133k.
- At list price, monthly cash flow is $-117 ($-1k/yr) — negative.
- To cash-flow at today's rent, offer at most $112k (15.5% below list).
- Meets the 1% rule at list price ($1k rent vs $133k).
- It's been on market 55 days — a 3% lower offer ($129k) is reasonable based on typical stale-listing flexibility.
- Recommended offer: $112k (15.5% below list) — sets the bar for cash-flow.
- Local home prices are declining (-3.0%/yr); year-one equity from $920 of loan paydown is wiped out by about $4k of value loss. Plan a longer hold.
- Location reads: area grade D — affects rentability + tenant quality, not the cash-flow math above.
- St. Louis Park Public School District (suburban): math 45% / reading 55% proficiency, ranked #100 of 301 in MN (top 33%) — acceptable for families but not a draw, mixed tenant base, ~2y average lease.
- Watch-outs: HOA is 29% of rent.
- Market conditions: Rents rising (+2.3%/yr); 205 active listings in the ZIP; 22 comparable units currently listed for rent nearby; rentals leasing fast (median 5d on market — plan ~1-2 weeks tenant-placement turnaround); solid renter incomes; 4,651 units permitted in Hennepin County in 2024 (2,443 in 5+ unit buildings).
- Hennepin County population projected at +30% by 2050 — long-run rental-demand tailwind backs the buy-and-hold thesis.
- 4 sale attempts since 22y ago with the ask held roughly flat each time — persistent listings suggest the price (not the market) is what's stuck; bring a comps-based counter.
- Current owner paid $98k; 36% above their basis — modest negotiation headroom, anchor on the comps not their cost.
- Cap rate 5.2% vs local median 3.1% in St. Louis Park — top-decile yield for the area; either an underpriced asset or a hidden risk that comps aren't pricing in. Stress-test before assuming the spread holds.
- This rent is only 17% of the median local income ($106k/yr) — well below the 30% rent-burden line; pricing power to push rent on renewal without tenant pushback.
Questions for listing agent
- What do current leases actually rent for vs. the listed asking? Can we see a recent rent roll and the last 12 months of T-12 income?
- It's been on market 55 days. Have you received any prior offers? Is the seller open to a 15% concession, seller financing, or rate buy-down credit?
- What does the HOA fee cover, when was the last increase, and are there any pending special assessments or reserve-fund shortfalls?
- Any open or pending special assessments — roof, HVAC, plumbing, elevator, façade? What's the per-unit balance and payoff schedule, and is the seller paying it off at close or rolling it to the buyer?
- Is there a deadline driving the sale (1031 exchange, divorce, estate, relocation)? That informs how much negotiation room exists.
- The area grade is low — what's the realistic commute time and amenity access for the typical tenant pool here? Any planned neighborhood developments (good or bad) we should know about?
- What's the average days-on-market for RENTAL listings here right now (not sales)? A rising rental-DOM trend means longer vacancies and softer asking-rent achievability than the comps imply.
- What's the recent tenant-quality profile in this submarket — average credit score on applications, eviction rate, late-payment / NSF rate, and stable-employment percentage? A property-management company in the area should have these aggregated.
CashFlowRE · CFR-RX9RE628Q7QN9K
· Data 2 days ago
cashflowre.app · 2026-05-29