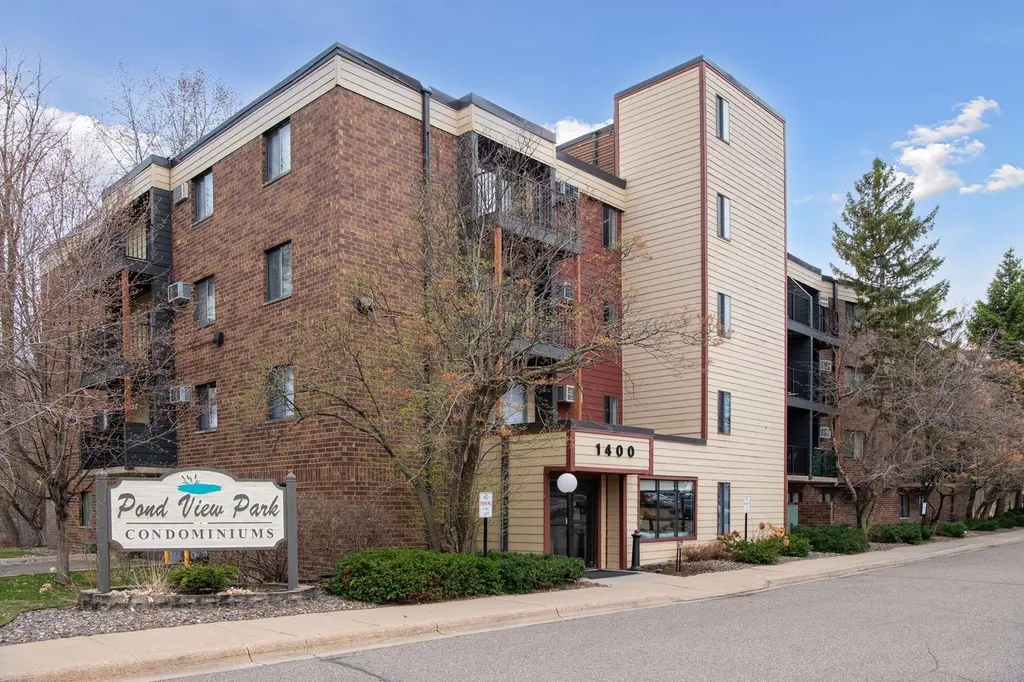
1400 Dakota Ave S #103 · St. Louis Park, MN
Flood risk 4/10 · Minor
- FEMA flood zone
- X
- Chance of flooding over 30 yrs
- 0.24%
- Est. flood insurance / yr
- $507 – $1,088
Fire risk 1/10 · Minimal
- Est. fire insurance / yr
- $888 – $1,650
Heat risk 2/10 · Minimal
- Hot days now (above 99°F)
- 7 days/yr
- Hot days in 30 yrs
- 14 days/yr
Wind risk 2/10 · Minimal
- Chance of severe wind over 30 yrs
- —
Air-quality risk 2/10 · Minimal
- Unhealthy air days now
- 2 days/yr
- Unhealthy air days in 30 yrs
- 2 days/yr
Risk factors via First Street. Map © Google.
Why this score? — see what drove the D grade
The composite is a weighted blend of 9 inputs, each scored 0–100. Each bar is that input's sub-score; the figure is the points it added to the 100-point composite (weight × sub-score).
- ARV discount +11.8/15.0
- Cash flow +8.5/30.0
- 1% rule +6.0/10.0
- Schools +4.4/10.0
- Rent growth +3.1/5.0
- Livability +2.5/5.0
- Condition / age +2.5/5.0
- DSCR +2.3/10.0
- Appreciation +0.0/10.0
$133,000
🖨 Deal sheet 📄 Offer letter ✓ Due diligence
Listing remarks
SWEET!!! Affordable unit with everything you have been looking for: heated underground parking, in-unit full sized laundry, elevator, dishwasher, pet-friendly association with no assessments & a covered balcony. There are also 2 large closets in the unit & 2 storage units as well! Cocoon yourself from the busy world in the efficiency-sized interior bedroom. Enjoy your morning coffee on the brand-new balcony. Cook your favorite meals in your own eat-in kitchen with stainless appliances (including a space-saving low-profile microwave) & granite counter tops. There is ample parking for your guests, and you can greet them in the tastefully remodeled lobby & take the ele
Key facts
- Covered balcony
- Large closets
- Storage units
Tags
Property features AI
Finance
- HOA & community: HOA managed by Sharper Management; Monthly association fee; Elevator(s), lobby entrance, and trails; HOA covers hazard insurance, heating, lawn care, grounds maintenance, parking, professional management, sewer, snow removal, and water
Exterior
- Parking: Underground parking; 1-car garage
- Utilities: City water; City sewer; Natural gas; Electric service with circuit breakers (100 amp)
- Home design: Attached residential property; One story; Accessible elevator installed
- Construction: Block foundation; Roof 8 years old or newer
- Exterior features: Covered patio/porch; Deck; Stone exterior
Interior
- Kitchen: Dishwasher; Disposal; Range; Refrigerator
- Bedrooms: 1 bedroom (main level)
- Bathrooms: 1 full bath (main floor)
- Heating & cooling: Baseboard heating; Boiler; Wall-mounted cooling unit(s)
- Interior features: All living facilities on one level; Main floor laundry; Daylight/lookout basement windows; Shared basement access; Walkout basement; Informal dining area
- Laundry & utility: In-unit washer and dryer; Washer/dryer hookup
Neighborhood map
What this means for you Summary
Snapshot
- This is a 1-bed/1.0-bath condo listed at $133k.
Deal economics
- At list price, monthly cash flow is $-117 ($-1k/yr) — negative.
- To cash-flow at today's rent, offer at most $112k (15.5% below list).
- Meets the 1% rule at list price ($1k rent vs $133k).
- Recommended offer: $112k (15.5% below list) — sets the bar for cash-flow.
- Cap rate 5.2% vs local median 3.1% in St. Louis Park — top-decile yield for the area; either an underpriced asset or a hidden risk that comps aren't pricing in. Stress-test before assuming the spread holds.
Location & tenants
- Location reads: area grade D — affects rentability + tenant quality, not the cash-flow math above.
- St. Louis Park Public School District (suburban): math 45% / reading 55% proficiency, ranked #100 of 301 in MN (top 33%) — acceptable for families but not a draw, mixed tenant base, ~2y average lease.
- Market conditions: Rents rising (+2.3%/yr); 205 active listings in the ZIP; 22 comparable units currently listed for rent nearby; rentals leasing fast (median 5d on market — plan ~1-2 weeks tenant-placement turnaround); solid renter incomes; 4,651 units permitted in Hennepin County in 2024 (2,443 in 5+ unit buildings).
- This rent is only 17% of the median local income ($106k/yr) — well below the 30% rent-burden line; pricing power to push rent on renewal without tenant pushback.
Forward outlook
- Local home prices are declining (-3.0%/yr); year-one equity from $920 of loan paydown is wiped out by about $4k of value loss. Plan a longer hold.
- Hennepin County population projected at +30% by 2050 — long-run rental-demand tailwind backs the buy-and-hold thesis.
Negotiation context
- It's been on market 55 days — a 3% lower offer ($129k) is reasonable based on typical stale-listing flexibility.
- 4 sale attempts since 22y ago with the ask held roughly flat each time — persistent listings suggest the price (not the market) is what's stuck; bring a comps-based counter.
- Current owner paid $98k; 36% above their basis — modest negotiation headroom, anchor on the comps not their cost.
Risks & watch-outs
- Watch-outs: HOA is 29% of rent.
Questions for the listing agent
- What do current leases actually rent for vs. the listed asking? Can we see a recent rent roll and the last 12 months of T-12 income?
- It's been on market 55 days. Have you received any prior offers? Is the seller open to a 15% concession, seller financing, or rate buy-down credit?
- What does the HOA fee cover, when was the last increase, and are there any pending special assessments or reserve-fund shortfalls?
- Any open or pending special assessments — roof, HVAC, plumbing, elevator, façade? What's the per-unit balance and payoff schedule, and is the seller paying it off at close or rolling it to the buyer?
- Is there a deadline driving the sale (1031 exchange, divorce, estate, relocation)? That informs how much negotiation room exists.
- The area grade is low — what's the realistic commute time and amenity access for the typical tenant pool here? Any planned neighborhood developments (good or bad) we should know about?
- What's the average days-on-market for RENTAL listings here right now (not sales)? A rising rental-DOM trend means longer vacancies and softer asking-rent achievability than the comps imply.
- What's the recent tenant-quality profile in this submarket — average credit score on applications, eviction rate, late-payment / NSF rate, and stable-employment percentage? A property-management company in the area should have these aggregated.
- How much new apartment / multifamily construction is in the pipeline within 1–3 miles? Heavy new supply (>2% of stock underway) typically softens rents 12–24 months out; light construction supports rent growth.
Investment metrics
- 1% rule
- 1.10% ✓
- Cap rate
- 5.24%
- Cash-on-cash
- -3.76%
- DSCR
- 0.83
- GRM
- 7.5
CMA / ARV
- ARV (median comp)
- $147,150
- List price
- $133,000
- Delta
- -9.62%
- Verdict
- FAIR
- Comps
- 1 within 2.0 mi
Projected returns pro-forma
-3.0% appreciation · 2.26% rent growth · sell at horizon
- IRR
- -23.5%
- Equity multiple
- 0.20×
- Total profit
- $-29,819
- Equity at exit
- $19,831
- IRR
- -20.8%
- Equity multiple
- -0.05×
- Total profit
- $-38,930
- Equity at exit
- $11,499
Cash invested: $37,240 (down + closing). Projections, not guarantees.
Landlord ↔ Tenant lean methodology
- Overall (STATE)
- 46 Balanced
- State Minnesota
- 46 Balanced · D+2
- County
- — inherits STATE
- City
- — inherits STATE
ZIP-level market 55416
- Rents YoY
- 2.3%
- Active inventory
- 205
- Price-to-rent
- 7.5×
Monthly cashflow live
- Estimated rent
- $1,468 high interval (Pro) →
- Mortgage (P&I)
- −$697
- Tax from tax record
- −$105 /mo · $1,257/yr
- Insurance
- −$55
- HOA
- −$419
- Vacancy / Maint / Mgmt
- −$308
- Net cashflow
- $-117
Break-even live
UW: 25.0% down · 7.5% · 30yr · 1.5% tax · 5.0% vac · 8.0% maint · 8.0% mgmt
Financing live
Cash to close
- Down payment
- $33,250
- Closing costs
- $3,990
- Reserves months
- —
- Total cash needed
- —
Loan-product check · same deal, 3 products live
Conventional
25% down · 7.5% · 30yr
- Down + closing
- —
- Monthly P&I
- —
- Monthly cashflow
- —
- DSCR
- —
- Eligible?
- —
Personal DTI + credit; lowest rate.
DSCR
20% down · 8.5% · 30yr
- Down + closing
- —
- Monthly P&I
- —
- Monthly cashflow
- —
- DSCR
- —
- Eligible?
- —
No personal income docs; deal must DSCR.
Hard money
10% down · 12.0% · 12mo
- Down + closing
- —
- Monthly P&I
- —
- Monthly cashflow
- —
- DSCR
- —
- Eligible?
- —
Short-term bridge; refi at stabilization.
Rent comps 22 comps
| Address | Beds | Baths | Sqft | Rent | $/sqft | DOM | Units | Dist |
|---|---|---|---|---|---|---|---|---|
| 1425 Colorado Ave S Unit 1427-218 St Louis Park, MN | 1.0 | 1.0 | 750 | $1,249 | $1.67 | 44d | 1 | 0.10mi |
| 1351 Hampshire Ave S Minneapolis, MN | 1.0–2.0 | 1.0 | 920 | $1,360 | $1.48 | 3d | 14 | 0.20mi |
| 1360 Hampshire Ave S Minneapolis, MN | 1.0–2.0 | 1.0–1.5 | 825 | $1,095 | $1.33 | 5d | 1 | 0.26mi |
| 6800 Cedar Lake Rd S Minneapolis, MN | 1.0–3.0 | 1.0–2.0 | 1017 | $1,730 | $1.70 | 2d | 11 | 0.44mi |
| 770 Xenia Ave S Minneapolis, MN | 2.0 | 1.0–2.0 | 894 | $2,278 | $2.55 | 2d | 30 | 0.56mi |
| 901 Xenia Ave S Minneapolis, MN | 2.0 | 1.0–2.0 | 826 | $2,052 | $2.48 | 2d | 11 | 0.57mi |
| 5310 W 16th St Minneapolis, MN | 1.0–2.0 | 1.0–2.0 | 857 | $1,625 | $1.90 | 2d | 10 | 0.69mi |
| 5743 Glenwood Ave Unit 5747-03 Golden Valley, MN | 1.0 | 1.0 | 720 | $995 | $1.38 | 18d | 1 | 0.72mi |
| 7414 W 22nd St #112 Minneapolis, MN | 1.0 | 1.0 | 739 | $1,350 | $1.83 | 44d | 1 | 0.73mi |
| 5235 Wayzata Blvd Minneapolis, MN | 2.0 | 1.0–2.0 | 997 | $2,892 | $2.90 | 2d | 14 | 0.76mi |
| 1325 Utica Ave S Minneapolis, MN | 3.0 | 1.0–2.0 | 1030 | $2,390 | $2.32 | 2d | 8 | 0.80mi |
| 1511 Utica Ave S Minneapolis, MN | 3.0 | 1.0–2.5 | 970 | $2,457 | $2.53 | 2d | 11 | 0.82mi |
| 29XX Nevada Ave S St Louis Park, MN | 1.0–2.0 | 1.0 | 865 | $1,150 | $1.33 | 5d | 19 | 0.86mi |
| 2480 Highway 100 S Minneapolis, MN | 1.0–2.0 | 1.0 | 755 | $1,195 | $1.58 | 2d | 2 | 0.95mi |
| 2235 Quebec Ave S Unit base Minneapolis, MN | 1.0 | 1.0 | 700 | $1,500 | $2.14 | 44d | 1 | 0.97mi |
| 2524 Minnesota 100 Unit 2514-0533 St Louis Park, MN | 1.0 | 1.0 | 450 | $1,299 | $2.89 | 44d | 1 | 0.99mi |
| 2524 Minnesota 100 Unit 2514-0513 St Louis Park, MN | 1.0 | 1.0 | 450 | $1,299 | $2.89 | 3d | 1 | 0.99mi |
| 2524 Minneapolis, MN | 1.0–2.0 | 1.0 | 700 | $1,299 | $1.86 | 12d | 5 | 1.01mi |
| 4815 Cedar Lake Rd S Minneapolis, MN | 1.0 | 1.0 | 665 | $1,020 | $1.53 | 11d | 4 | 1.02mi |
| 5621 Minnetonka Blvd Minneapolis, MN | 1.0–2.0 | 1.0 | 800 | $1,279 | $1.60 | 12d | 2 | 1.41mi |
| 600 Lilac Dr N Minneapolis, MN | 1.0 | 1.0 | 600 | $1,307 | $2.18 | 2d | 7 | 1.45mi |
| 3000 Highway 100 S Minneapolis, MN | 1.0–2.0 | 1.0–1.5 | 867 | $1,175 | $1.35 | 15d | 3 | 1.49mi |
HOA detail condo
- Monthly dues
- $419 · $5,028/yr
- Assessments
- None detected in remarks — confirm with the listing agent.
Listing history 23 events
-
2026-06-18days on market $133,000 Active 55 DOM
-
2026-06-17days on market $133,000 Active 54 DOM
-
2026-06-16days on market $133,000 Active 53 DOM
-
2026-06-15days on market $133,000 Active 52 DOM
-
2026-06-13days on market $133,000 Active 50 DOM
-
2026-06-09days on market $133,000 Active 46 DOM
-
2026-06-08days on market $133,000 Active 45 DOM
-
2026-06-07days on market $133,000 Active 44 DOM
-
2026-06-04days on market $133,000 Active 41 DOM
-
2026-06-03days on market $133,000 Active 40 DOM
-
2026-06-02days on market $133,000 Active 39 DOM
-
2026-06-01days on market $133,000 Active 38 DOM
-
2026-05-31days on market $133,000 Active 37 DOM
-
2026-04-24$133,000 Active 1376-char remark
-
2026-04-19historical
-
2026-03-07$135,000 Active
-
2026-03-06historical
-
2019-01-29soldstatus $98,000
-
2008-03-13historical
-
2008-01-14$125,000
-
2004-09-03soldstatus $101,243
-
2004-07-30historical
-
2004-07-30$99,397
ⓘ Source: listings_history table (triggers on properties + properties_extension) + one-shot
backfill from property_details.listing_events for pre-trigger history.
Tax reassessment forecast MN · Partial reset (capped growth)
- Current annual tax
- $1,257 · $105/mo
- Projected year-2 tax
- $1,373 · $114/mo
- Expected delta
- +$116/yr (+$10/mo · 9.2%)
ⓘ Screening estimate from a state-policy table — verify with the county assessor before closing.
Climate risk First Street
- Flood 4/10 Moderate FEMA zone X · 24% chance over 30 yrs
- Wildfire 1/10 Low
- Heat 2/10 Low 7 d/yr ≥99°F today · 14 d/yr by 30 yrs out
- Wind 2/10 Low
- Air quality 2/10 Low 2 unhealthy d/yr today · 2 by 30 yrs out
Nearby sold comps map
Loading sold comps map…
Walkable amenities ~0.75 mi
Loading nearby amenities…
Taxation est. · year 1
- Rental income
- $17,622
- − Mortgage interest
- −$7,450
- − Property taxes
- −$1,257
- − Insurance
- −$665
- − Repairs & maintenance
- −$1,410
- − Management
- −$1,410
- − HOA
- −$5,028
- − Depreciation
- −$3,869
- Taxable loss
- −$3,467
- Est. tax savings @ 24.0%
- +$832
- After-tax cash flow
- $-567/yr
For passive investors: Depreciation is non-cash, so a rental often shows a tax loss while cash-flowing — sheltering income. Rental losses are passive: they offset passive income freely, and up to $25,000/yr can offset ordinary (W-2) income if you actively participate and your MAGI is under $100k (phasing out to $0 by $150k); unused losses carry forward. On sale, claimed depreciation is recaptured at up to 25%, and gains may owe capital-gains tax (a 1031 exchange can defer both). Figures are a year-1 estimate at your 24.0% rate — not tax advice; consult a CPA.
Schools (NCES district)
- District
- St. Louis Park Public School District
- NCES district ID
- 2733780
- Math proficiency
- 45% ▼ -8.00%
- Reading proficiency
- 55% ▼ -4.00%
- Median HH income
- $65,785
- Composite
- 44.26/100
- National rank
- #2840
- State rank
- #100 of 301 in MN
Livability — St. Louis Park
No livability data for this city. (Only ~50 U.S. cities are tracked.)
Census & demographics
- Census place
- St. Louis Park, MN
- County
- Hennepin County · 1,150,272 people
- City population
- 60,356
- Metro
- Minneapolis-St. Paul-Bloomington, MN-WI
- Population (ZIP)
- 35,015
- Household income
- $105,958
- Rent vs Own
- Severe rent burden
- 1213.0
Population outlook (Hennepin County) Hauer SSP2
- Today (2025)
- 1,405,227 people
- By 2030
- 1,492,650 · +6.2%
- By 2040
- 1,660,157 · +18.1%
- By 2050
- 1,823,498 · +29.8%
- By 2075
- 2,221,283 · +58.1%
- By 2100
- 2,509,976 · +78.6%
Race, ethnicity, and origin ACS 2023
- Neighborhood character
- Predominantly White (79%)
- Race & ethnicity
- White 79% Two or more races 9% Hispanic / Latino 8% Black 5% Asian 4%
- Hispanic origin (detail)
- Mexican 4%
- Common ancestry
- Portuguese 12% Romanian 5% Lithuanian 4%
- Foreign-born
- 8% · Canada, China, South Korea
- Languages at home
- 89% English-only · Spanish 4% Other Indo-European 1% Other Asian/Pacific 1%
Political lean MEDSL · Hennepin
- 2024 margin
- Solid D (+42.6) · D 70.2% · R 27.5% · Other 2.3%
- 2008→2024 swing
- +14.0pp toward D · 2008: 28.6pp · 2024: 42.6pp
- All cycles
- 2024: D+42.6 2020: D+43.2 2016: D+35.3 2012: D+27.1 2008: D+28.6
Not yet ingested
- Civics
- —
Market trends
- HPI YoY
- ▼ -490.63%
- Current HPI
- 230.651
- Rent YoY
- ▲ 2.26%
- Metro
- Minneapolis-St. Paul-Bloomington, MN-WI
- State GDP YoY
- ▲ 2.41%
- F500 in state
- 34
Industry mix (Fortune 500 HQ in MN)
| Industry | F500 HQs | Revenue |
|---|---|---|
| Healthcare | 2 | $407B |
|
||
| Retail | 2 | $150B |
|
||
| Consumer Goods | 2 | $32B |
|
||
| Industrial Machinery | 2 | $6B |
|
||
| Agriculture | 1 | $40B |
|
||
| Healthcare / Medical Devices | 1 | $32B |
|
||
Price history
+33.8% since first listed10 events — show timeline
- 2026-04-24 Listed $133,000 NORTHSTARMLS as Distributed by MLS Grid
- 2026-04-19 Listing Removed — NORTHSTARMLS as Distributed by MLS Grid
- 2026-03-07 Listed $135,000 NORTHSTARMLS as Distributed by MLS Grid
- 2026-03-06 Coming Soon — NORTHSTARMLS as Distributed by MLS Grid
- 2019-01-29 Sold (Public Records) $98,000 Public Records
- 2008-03-13 Listing Removed — NORTHSTARMLS as Distributed by MLS Grid
- 2008-01-14 Listed $125,000 NORTHSTARMLS as Distributed by MLS Grid
- 2004-09-03 Sold (MLS) $101,243 NORTHSTARMLS as Distributed by MLS Grid
- 2004-07-30 Listed $99,397 NORTHSTARMLS as Distributed by MLS Grid
- 2004-07-30 Listing Removed — NORTHSTARMLS as Distributed by MLS Grid
Property tax history
+0.7%/yrLatest (2025): $1,257 · -6.5% YoY. Source: county tax records.
Cash-flow waterfall
monthlySold comps — $/sqft
last 12 mo · ≤1 miLoading sold comps…