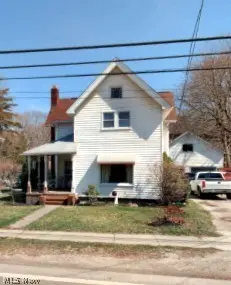
181 River St
Madison, OH 44057
$109,000B
3 bd · 2.0 ba ·
1,732 sqft ·
Built 1900
· SingleFamily
· Active
· 26 DOM
Cashflow @ list (25.0% down · 7.5%)
Estimated rent
$1,873/mo
Mortgage (P&I)
−$572
Tax + insurance
−$271
HOA
−$0
Vac / Maint / Mgmt
−$393
Net cashflow
$637/mo
Annual
$7,647/yr
Cap rate
13.31%
Cash-on-cash
25.06%
DSCR
2.11
1% rule
1.72%
Cash to close
$30,520
Investor read
- This is a 3-bed/2.0-bath single-family listed at $109k.
- At list price, monthly cash flow is $637 ($8k/yr) — positive.
- The deal already cash-flows at list — no discount required.
- Meets the 1% rule at list price ($2k rent vs $109k).
- It's been on market 26 days — a 2% lower offer ($107k) is reasonable based on typical stale-listing flexibility.
- Recommended offer: $107k (1.5% below list) — sets the bar for market timing.
- Local home prices are declining (-3.0%/yr); year-one equity from $754 of loan paydown is wiped out by about $3k of value loss. Plan a longer hold.
- Location reads 75/100 on livability (#250 in OH, #3,982 nationally) — a middle-class / working-renter tenant base. Strengths: crime A+, employment A+, cost of living A+; Watch: health & safety D, amenities F, commute F.
- Madison Local (suburban): math 58% / reading 59% proficiency, ranked #308 of 656 in OH (top 47%) — acceptable for families but not a draw, mixed tenant base, ~2y average lease.
- Watch-outs: built in 1900 — expect roof / HVAC / electrical / plumbing capex.
- Market conditions: 96 active listings in the ZIP; 448 units permitted in Lake County in 2024 (0 in 5+ unit buildings).
- Lake County population projected to shrink 8% by 2050 — rents likely to lag national; underwrite the cash flow, not the appreciation.
- 2 sale attempts with the ask held roughly flat each time — persistent listings suggest the price (not the market) is what's stuck; bring a comps-based counter.
- At projected returns (-3.0% appreciation + 3.0% rent growth), your $31k cash investment doubles in ~5 years — after that, you're playing with house money.
- Cap rate 13.3% vs local median 5.5% in Madison — top-decile yield for the area; either an underpriced asset or a hidden risk that comps aren't pricing in. Stress-test before assuming the spread holds.
- This rent runs 32% of the median local income ($70k/yr) — at the standard rent-burdened threshold; future hikes will face affordability resistance.
Questions for listing agent
- Built in 1900 — when were the roof, HVAC, electrical panel, plumbing, and water heater last replaced?
- Is there a deadline driving the sale (1031 exchange, divorce, estate, relocation)? That informs how much negotiation room exists.
- Schools are B-rated — typically a magnet for longer-tenancy family renters. What's the average tenant stay here, and is there a school-zone premium baked into asking?
- What's the average days-on-market for RENTAL listings here right now (not sales)? A rising rental-DOM trend means longer vacancies and softer asking-rent achievability than the comps imply.
- What's the recent tenant-quality profile in this submarket — average credit score on applications, eviction rate, late-payment / NSF rate, and stable-employment percentage? A property-management company in the area should have these aggregated.
- How much new for-sale + rental construction is in the pipeline within 1–3 miles? Heavy new supply typically softens prices + rents 12–24 months out; constrained supply supports both.
CashFlowRE · CFR-RXCCEM0BN2YBR6
· Data 2 days ago
cashflowre.app · 2026-05-29