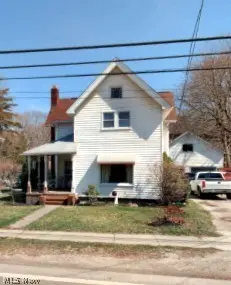
181 River St · Madison, OH
Flood risk 1/10 · Minimal
- FEMA flood zone
- X (unshaded)
- Chance of flooding over 30 yrs
- 0.0%
- Est. flood insurance / yr
- $473 – $860
Fire risk 1/10 · Minimal
- Est. fire insurance / yr
- $713 – $1,323
Heat risk 2/10 · Minimal
- Hot days now (above 97°F)
- 7 days/yr
- Hot days in 30 yrs
- 17 days/yr
Wind risk 1/10 · Minimal
- Chance of severe wind over 30 yrs
- —
Air-quality risk 3/10 · Minor
- Unhealthy air days now
- 2 days/yr
- Unhealthy air days in 30 yrs
- 5 days/yr
Risk factors via First Street. Map © Google.
Why this score? — see what drove the B grade
The composite is a weighted blend of 9 inputs, each scored 0–100. Each bar is that input's sub-score; the figure is the points it added to the 100-point composite (weight × sub-score).
- Cash flow +30.0/30.0
- 1% rule +10.0/10.0
- DSCR +10.0/10.0
- ARV discount +7.5/15.0
- Schools +5.0/10.0
- Livability +3.8/5.0
- Rent growth +2.5/5.0
- Condition / age +2.5/5.0
- Appreciation +0.0/10.0
$109,000
🖨 Deal sheet 📄 Offer letter ✓ Due diligence
Listing remarks
Step back in time and imagine the possibilities with this classic Madison century home, ideally located just moments from Madison's charming village square. Rich with character and architectural details from a bygone era, this spacious home features high ceilings, generously sized rooms, and the timeless craftsmanship that makes historic homes so special. The large kitchen offers abundant space for gathering and entertaining, while the expansive yard provides room for gardening, recreation, or future outdoor living spaces. Enjoy being within close proximity to Madison Square's local shops, restaurants, seasonal events, and community activities. This home is ready for a new owner with vision
Key facts
- Remodeled kitchen
- Large wooded lot
- Detached garage
Tags
Property features AI
Exterior
- Parking: Attached garage with 4 spaces; Driveway
- Utilities: Public water; Public sewer; Public power available
- Home design: Two-story home; Aluminum siding exterior; Block foundation; Asphalt roof
- Construction: Built (year per public records); Aluminum siding construction; Block foundation; Asphalt roof
- Exterior features: Half-acre lot
Interior
- Kitchen: Eat-in kitchen; Additional kitchen area
- Bedrooms: Bedrooms located on the second floor
- Flooring: Hardwood and wood flooring in multiple rooms
- Bathrooms: Two full bathrooms; One main-level bathroom
- Heating & cooling: Gas heating; Hot water heating; Steam heating
- Interior features: Basement; Fireplace (1)
- Laundry & utility: Main-level laundry room; Utility room on the first floor
Neighborhood map
What this means for you Summary
Snapshot
- This is a 3-bed/2.0-bath single-family listed at $109k.
Deal economics
- At list price, monthly cash flow is $637 ($8k/yr) — positive.
- The deal already cash-flows at list — no discount required.
- Meets the 1% rule at list price ($2k rent vs $109k).
- Recommended offer: $107k (1.5% below list) — sets the bar for market timing.
- Cap rate 13.3% vs local median 5.5% in Madison — top-decile yield for the area; either an underpriced asset or a hidden risk that comps aren't pricing in. Stress-test before assuming the spread holds.
Location & tenants
- Location reads 75/100 on livability (#250 in OH, #3,982 nationally) — a middle-class / working-renter tenant base. Strengths: crime A+, employment A+, cost of living A+; Watch: health & safety D, amenities F, commute F.
- Madison Local (suburban): math 58% / reading 59% proficiency, ranked #308 of 656 in OH (top 47%) — acceptable for families but not a draw, mixed tenant base, ~2y average lease.
- Market conditions: 96 active listings in the ZIP; 448 units permitted in Lake County in 2024 (0 in 5+ unit buildings).
- This rent runs 32% of the median local income ($70k/yr) — at the standard rent-burdened threshold; future hikes will face affordability resistance.
Forward outlook
- Local home prices are declining (-3.0%/yr); year-one equity from $754 of loan paydown is wiped out by about $3k of value loss. Plan a longer hold.
- Lake County population projected to shrink 8% by 2050 — rents likely to lag national; underwrite the cash flow, not the appreciation.
- At projected returns (-3.0% appreciation + 3.0% rent growth), your $31k cash investment doubles in ~5 years — after that, you're playing with house money.
Negotiation context
- It's been on market 26 days — a 2% lower offer ($107k) is reasonable based on typical stale-listing flexibility.
- 2 sale attempts with the ask held roughly flat each time — persistent listings suggest the price (not the market) is what's stuck; bring a comps-based counter.
Risks & watch-outs
- Watch-outs: built in 1900 — expect roof / HVAC / electrical / plumbing capex.
Questions for the listing agent
- Built in 1900 — when were the roof, HVAC, electrical panel, plumbing, and water heater last replaced?
- Is there a deadline driving the sale (1031 exchange, divorce, estate, relocation)? That informs how much negotiation room exists.
- Schools are B-rated — typically a magnet for longer-tenancy family renters. What's the average tenant stay here, and is there a school-zone premium baked into asking?
- What's the average days-on-market for RENTAL listings here right now (not sales)? A rising rental-DOM trend means longer vacancies and softer asking-rent achievability than the comps imply.
- What's the recent tenant-quality profile in this submarket — average credit score on applications, eviction rate, late-payment / NSF rate, and stable-employment percentage? A property-management company in the area should have these aggregated.
- How much new for-sale + rental construction is in the pipeline within 1–3 miles? Heavy new supply typically softens prices + rents 12–24 months out; constrained supply supports both.
Investment metrics
- 1% rule
- 1.72% ✓
- Cap rate
- 13.31%
- Cash-on-cash
- 25.06%
- DSCR
- 2.11
- GRM
- 4.8
CMA / ARV
No comps found within radius.
Projected returns pro-forma
-3.0% appreciation · 3.0% rent growth · sell at horizon
- IRR
- 18.6%
- Equity multiple
- 1.75×
- Total profit
- $23,010
- Equity at exit
- $16,252
- IRR
- 27.0%
- Equity multiple
- 3.38×
- Total profit
- $72,640
- Equity at exit
- $9,424
Cash invested: $30,520 (down + closing). Projections, not guarantees.
Landlord ↔ Tenant lean methodology
- Overall (STATE)
- 73 Landlord-Friendly
- State Ohio
- 73 Landlord-Friendly · R+6
- County
- — inherits STATE
- City
- — inherits STATE
ZIP-level market 44057
- Active inventory
- 96
- Price-to-rent
- 4.8×
Monthly cashflow live
- Estimated rent
- $1,873 medium interval (Pro) →
- Mortgage (P&I)
- −$572
- Tax from tax record
- −$226 /mo · $2,706/yr
- Insurance
- −$45
- HOA
- −$0
- Vacancy / Maint / Mgmt
- −$393
- Net cashflow
- $637
Break-even live
UW: 25.0% down · 7.5% · 30yr · 1.5% tax · 5.0% vac · 8.0% maint · 8.0% mgmt
Financing live
Cash to close
- Down payment
- $27,250
- Closing costs
- $3,270
- Reserves months
- —
- Total cash needed
- —
Loan-product check · same deal, 3 products live
Conventional
25% down · 7.5% · 30yr
- Down + closing
- —
- Monthly P&I
- —
- Monthly cashflow
- —
- DSCR
- —
- Eligible?
- —
Personal DTI + credit; lowest rate.
DSCR
20% down · 8.5% · 30yr
- Down + closing
- —
- Monthly P&I
- —
- Monthly cashflow
- —
- DSCR
- —
- Eligible?
- —
No personal income docs; deal must DSCR.
Hard money
10% down · 12.0% · 12mo
- Down + closing
- —
- Monthly P&I
- —
- Monthly cashflow
- —
- DSCR
- —
- Eligible?
- —
Short-term bridge; refi at stabilization.
Listing history 16 events
-
2026-06-18days on market $109,000 Active 26 DOM
-
2026-06-17days on market $109,000 Active 25 DOM
-
2026-06-16days on market $109,000 Active 24 DOM
-
2026-06-15days on market $109,000 Active 23 DOM
-
2026-06-13days on market $109,000 Active 21 DOM
-
2026-06-12days on market $109,000 Active 20 DOM
-
2026-06-09days on market $109,000 Active 17 DOM
-
2026-06-08days on market $109,000 Active 16 DOM
-
2026-06-08days on market $109,000 Active 15 DOM
-
2026-06-07days on market $109,000 Active 14 DOM
-
2026-06-04days on market $109,000 Active 11 DOM
-
2026-06-02days on market $109,000 Active 10 DOM
-
2026-06-01days on market $109,000 Active 9 DOM
-
2026-05-31days on market $109,000 Active 8 DOM
-
2026-05-23status Active
-
2026-05-15$109,000 Active
ⓘ Source: listings_history table (triggers on properties + properties_extension) + one-shot
backfill from property_details.listing_events for pre-trigger history.
Tax reassessment forecast OH · Partial reset (capped growth)
- Current annual tax
- $2,706 · $226/mo
- Projected year-2 tax
- $2,706 · $226/mo
- Expected delta
- $0/yr ($0/mo · 0.0%)
ⓘ Screening estimate from a state-policy table — verify with the county assessor before closing.
Climate risk First Street
- Flood 1/10 Low FEMA zone X (unshaded) · 0% chance over 30 yrs
- Wildfire 1/10 Low
- Heat 2/10 Low 7 d/yr ≥97°F today · 17 d/yr by 30 yrs out
- Wind 1/10 Low
- Air quality 3/10 Moderate 2 unhealthy d/yr today · 5 by 30 yrs out
Nearby sold comps map
Loading sold comps map…
Walkable amenities ~0.75 mi
Loading nearby amenities…
Taxation est. · year 1
- Rental income
- $22,478
- − Mortgage interest
- −$6,106
- − Property taxes
- −$2,706
- − Insurance
- −$545
- − Repairs & maintenance
- −$1,798
- − Management
- −$1,798
- − Depreciation
- −$3,171
- Taxable income
- $6,354
- Est. tax owed @ 24.0%
- −$1,525
- After-tax cash flow
- $6,123/yr
For passive investors: Depreciation is non-cash, so a rental often shows a tax loss while cash-flowing — sheltering income. Rental losses are passive: they offset passive income freely, and up to $25,000/yr can offset ordinary (W-2) income if you actively participate and your MAGI is under $100k (phasing out to $0 by $150k); unused losses carry forward. On sale, claimed depreciation is recaptured at up to 25%, and gains may owe capital-gains tax (a 1031 exchange can defer both). Figures are a year-1 estimate at your 24.0% rate — not tax advice; consult a CPA.
Schools (NCES district)
- District
- Madison Local
- NCES district ID
- 3904788
- Math proficiency
- 58% ▼ -7.00%
- Reading proficiency
- 59% ▼ -6.00%
- Median HH income
- $51,608
- Composite
- 49.99/100
- National rank
- #1924
- State rank
- #308 of 656 in OH
Livability — Madison
- Score
- 75/100
- State rank
- #250
- US rank
- #3982
Category grades
Schools grade is shown separately in the Schools card above.
Census & demographics
- Census place
- Madison, OH
- County
- Lake · 224,932 people
- City population
- 19,491
- Metro
- Cleveland, OH
- Population (ZIP)
- 19,491
- Household income
- $70,212
- Rent vs Own
- Severe rent burden
- 8.5
Population outlook (Lake County) Hauer SSP2
- Today (2025)
- 230,022 people
- By 2030
- 228,151 · -0.8%
- By 2040
- 221,018 · -3.9%
- By 2050
- 212,754 · -7.5%
- By 2075
- 200,309 · -12.9%
- By 2100
- 183,315 · -20.3%
Race, ethnicity, and origin ACS 2023
- Neighborhood character
- Predominantly White (93%)
- Race & ethnicity
- White 93% Two or more races 5% Hispanic / Latino 2%
- Common ancestry
- Romanian 6% Scotch-Irish 2% Slovak 2%
- Foreign-born
- 2% · Canada
- Languages at home
- 97% English-only · Spanish 2%
Political lean MEDSL · Lake
- 2024 margin
- R (+14.3) · D 42.4% · R 56.7%
- 2008→2024 swing
- -15.2pp toward R · 2008: 0.8pp · 2024: -14.3pp
- All cycles
- 2024: R+14.3 2020: R+13.6 2016: R+15.6 2012: R+1.7 2008: D+0.8
Not yet ingested
- Civics
- —
Market trends
- HPI YoY
- ▼ -241.42%
- Current HPI
- 187.8978
- Rent YoY
- —
- Metro
- —
- State GDP YoY
- ▲ 1.98%
- F500 in state
- 48
Industry mix (Fortune 500 HQ in OH)
| Industry | F500 HQs | Revenue |
|---|---|---|
| Insurance | 3 | $145B |
|
||
| Industrial Machinery | 3 | $49B |
|
||
| Financial Services | 3 | $24B |
|
||
| Consumer Goods | 2 | $93B |
|
||
| Aerospace / Defense | 2 | $47B |
|
||
| Utilities | 2 | $33B |
|
||
Price history
2 events — show timeline
- 2026-05-23 Relisted — MLSNOW
- 2026-05-15 Listed $109,000 MLSNOW
Property tax history
+1.6%/yrLatest (2025): $2,706 · -1.9% YoY. Source: county tax records.
Cash-flow waterfall
monthlySold comps — $/sqft
last 12 mo · ≤1 miLoading sold comps…