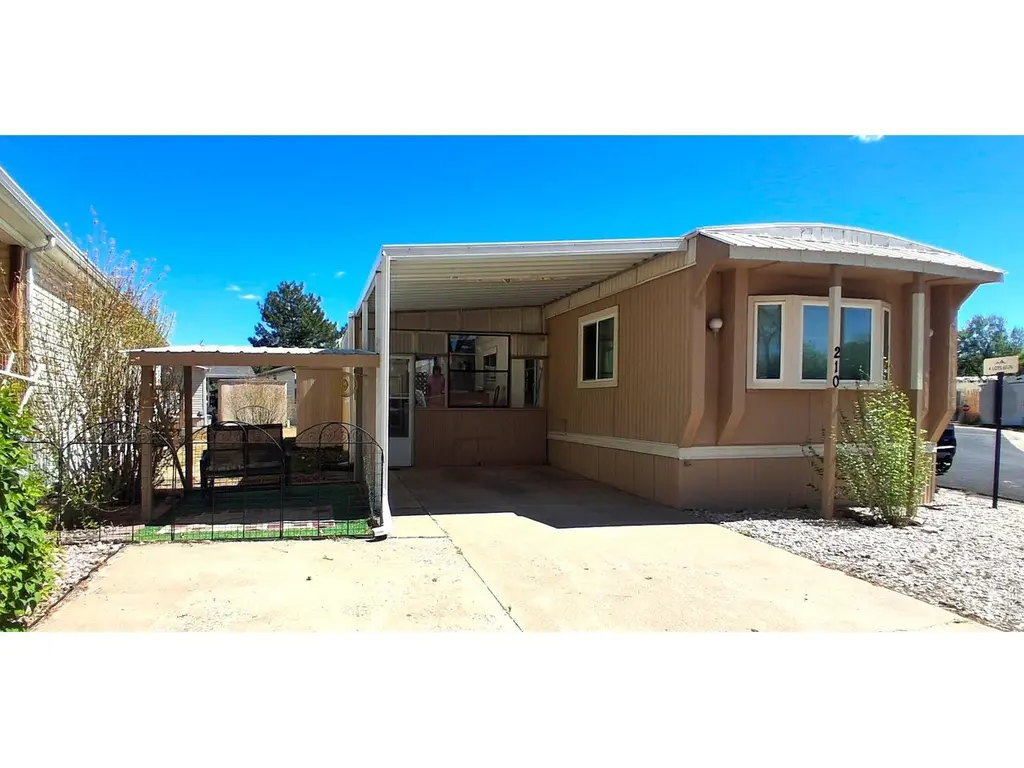
1166 Madison Ave #210
Loveland, CO 80537
$35,000C-
2 bd · 2.0 ba ·
938 sqft ·
Built 1980
· Manufactured
· Active
· 48 DOM
Cashflow @ list (25.0% down · 7.5%)
Estimated rent
$1,518/mo
Mortgage (P&I)
−$184
Tax + insurance
−$24
HOA
−$0
Vac / Maint / Mgmt
−$319
Net cashflow
$992/mo
Annual
$11,904/yr
Cap rate
40.31%
Cash-on-cash
121.47%
DSCR
6.40
1% rule
4.34%
Cash to close
$9,800
Investor read
- This is a 2-bed/2.0-bath manufactured listed at $35k.
- At list price, monthly cash flow is $992 ($12k/yr) — positive.
- The deal already cash-flows at list — no discount required.
- Meets the 1% rule at list price ($2k rent vs $35k).
- It's been on market 48 days — a 3% lower offer ($34k) is reasonable based on typical stale-listing flexibility.
- Recommended offer: $34k (3.0% below list) — sets the bar for market timing.
- Local home prices are declining (-3.0%/yr); year-one equity from $242 of loan paydown is wiped out by about $1k of value loss. Plan a longer hold.
- Location reads 73/100 on livability (#52 in CO) — a middle-class / working-renter tenant base. Strengths: housing A+, health & safety A+, amenities A; Watch: crime C-, commute F, cost of living F.
- Thompson School District R-2J (suburban): math 28% / reading 48% proficiency, ranked #28 of 86 in CO (top 33%) — families likely to look elsewhere, expect single-tenant / working-renter base with shorter leases.
- Market conditions: Rents rising (+3.6%/yr); 283 active listings in the ZIP; 34 comparable units currently listed for rent nearby; rentals at typical pace (median 24d on market — plan ~3-4 weeks tenant-placement turnaround); solid renter incomes; 1,786 units permitted in Larimer County in 2024 (402 in 5+ unit buildings).
- Larimer County population projected at +51% by 2050 — long-run rental-demand tailwind backs the buy-and-hold thesis.
- 2 sale attempts; this cycle's ask is 17% above the opening price — seller raised mid-cycle; expect resistance to lowballs.
- At projected returns (-3.0% appreciation + 3.6% rent growth), your $10k cash investment doubles in ~1 year — after that, you're playing with house money.
- Climate carrying-cost: moderate wildfire risk — expect insurance premiums to compound above CPI over the hold.
- Cap rate 40.3% vs local median 2.9% in Loveland — top-decile yield for the area; either an underpriced asset or a hidden risk that comps aren't pricing in. Stress-test before assuming the spread holds.
Questions for listing agent
- It's been on market 48 days. Have you received any prior offers? Is the seller open to a 3% concession, seller financing, or rate buy-down credit?
- Is there a deadline driving the sale (1031 exchange, divorce, estate, relocation)? That informs how much negotiation room exists.
- What's the average days-on-market for RENTAL listings here right now (not sales)? A rising rental-DOM trend means longer vacancies and softer asking-rent achievability than the comps imply.
- What's the recent tenant-quality profile in this submarket — average credit score on applications, eviction rate, late-payment / NSF rate, and stable-employment percentage? A property-management company in the area should have these aggregated.
- How much new for-sale + rental construction is in the pipeline within 1–3 miles? Heavy new supply typically softens prices + rents 12–24 months out; constrained supply supports both.
CashFlowRE · CFR-RXD2T2DWP45WM9
· Data 2 days ago
cashflowre.app · 2026-05-29