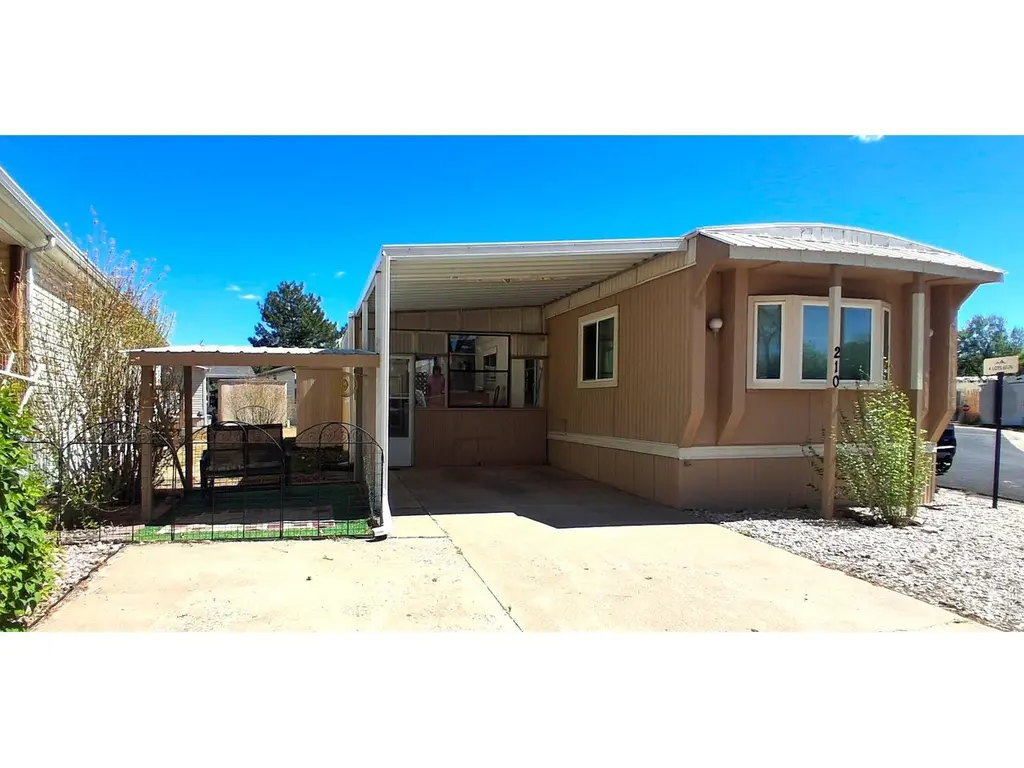
1166 Madison Ave #210 · Loveland, CO
Flood risk 1/10 · Minimal
- FEMA flood zone
- X (unshaded)
- Chance of flooding over 30 yrs
- 0.0%
- Est. flood insurance / yr
- $507 – $1,088
Fire risk 5/10 · Moderate
- Est. fire insurance / yr
- $939 – $1,743
Heat risk 3/10 · Minor
- Hot days now (above 92°F)
- 7 days/yr
- Hot days in 30 yrs
- 19 days/yr
Wind risk 1/10 · Minimal
- Chance of severe wind over 30 yrs
- —
Air-quality risk 4/10 · Minor
- Unhealthy air days now
- 6 days/yr
- Unhealthy air days in 30 yrs
- 8 days/yr
Risk factors via First Street. Map © Google.
Why this score? — see what drove the C- grade
The composite is a weighted blend of 9 inputs, each scored 0–100. Each bar is that input's sub-score; the figure is the points it added to the 100-point composite (weight × sub-score).
- Cash flow +15.0/30.0
- ARV discount +15.0/15.0
- 1% rule +5.0/10.0
- DSCR +5.0/10.0
- Livability +3.7/5.0
- Rent growth +3.4/5.0
- Schools +3.4/10.0
- Condition / age +2.5/5.0
- Appreciation +0.0/10.0
$35,000
🖨 Deal sheet 📄 Offer letter ✓ Due diligence
Listing remarks
Welcome to easy living in one of Loveland's desirable gated 55+ communities! Situated on a corner lot directly across from the community park, this charming 2-bedroom, 1-bath 1980 mobile home offers a peaceful setting with beautiful views of the park's mature grand trees, shaded green space, and covered community seating area just steps away. This home has a fun retro vibe full of character and possibility - whether you love vintage charm or want to create your own updated style, the space offers endless potential to make it uniquely yours. Comfortable in size yet easy to maintain, this home is ideal for buyers looking to simplify life without sacrificing comfort. The kitchen offers great f
Key facts
- Gated community
- Outdoor seating area
- Covered carport
Tags
Property features AI
Finance
- Other: No listed improvements; Builder: Bonnavilla; Directions: When entering the park, continue forward and around the park. Home is on the east side of the park.
- HOA & community: No association fees
Exterior
- Parking: Carport
- Utilities: City water (meter installed); Public sewer; Natural gas available (Xcel); Electricity available; Cable available; Satellite available; Trash service billed through the park (Waste Management)
- Home design: Manufactured in-park (mobile home); HUD undercarriage
- Construction: Frame construction; Metal roof
- Exterior features: Enclosed patio; Storage structure; Land lease community; Partial fencing; Other type fencing; Corner lot; Paved lot; Privately maintained road to county standards; Level lot; Level drive; Near bus
Interior
- Kitchen: Electric range; Refrigerator
- Bedrooms: 2 bedrooms
- Bathrooms: 1 full bathroom
- Heating & cooling: Forced air heating; Wall/window air conditioning units; Evaporative cooling; Ceiling fans
- Interior features: Eat-in kitchen; Window coverings; Fire alarm; Trombe wall (passive solar/green energy feature)
- Laundry & utility: Washer; Dryer
Neighborhood map
What this means for you Summary
Snapshot
- This is a 2-bed/2.0-bath manufactured listed at $35k.
Deal economics
- At list price, monthly cash flow is $992 ($12k/yr) — positive.
- The deal already cash-flows at list — no discount required.
- Meets the 1% rule at list price ($2k rent vs $35k).
- Recommended offer: $34k (3.0% below list) — sets the bar for market timing.
- Cap rate 40.3% vs local median 2.9% in Loveland — top-decile yield for the area; either an underpriced asset or a hidden risk that comps aren't pricing in. Stress-test before assuming the spread holds.
Location & tenants
- Location reads 73/100 on livability (#52 in CO) — a middle-class / working-renter tenant base. Strengths: housing A+, health & safety A+, amenities A; Watch: crime C-, commute F, cost of living F.
- Thompson School District R-2J (suburban): math 28% / reading 48% proficiency, ranked #28 of 86 in CO (top 33%) — families likely to look elsewhere, expect single-tenant / working-renter base with shorter leases.
- Market conditions: Rents rising (+3.6%/yr); 283 active listings in the ZIP; 34 comparable units currently listed for rent nearby; rentals at typical pace (median 23d on market — plan ~3-4 weeks tenant-placement turnaround); solid renter incomes; 1,786 units permitted in Larimer County in 2024 (402 in 5+ unit buildings).
Forward outlook
- Local home prices are declining (-3.0%/yr); year-one equity from $242 of loan paydown is wiped out by about $1k of value loss. Plan a longer hold.
- Larimer County population projected at +51% by 2050 — long-run rental-demand tailwind backs the buy-and-hold thesis.
- At projected returns (-3.0% appreciation + 3.6% rent growth), your $10k cash investment doubles in ~1 year — after that, you're playing with house money.
Negotiation context
- It's been on market 48 days — a 3% lower offer ($34k) is reasonable based on typical stale-listing flexibility.
- 2 sale attempts; this cycle's ask is 17% above the opening price — seller raised mid-cycle; expect resistance to lowballs.
Risks & watch-outs
- Climate carrying-cost: moderate wildfire risk — expect insurance premiums to compound above CPI over the hold.
Questions for the listing agent
- It's been on market 48 days. Have you received any prior offers? Is the seller open to a 3% concession, seller financing, or rate buy-down credit?
- Is there a deadline driving the sale (1031 exchange, divorce, estate, relocation)? That informs how much negotiation room exists.
- What's the average days-on-market for RENTAL listings here right now (not sales)? A rising rental-DOM trend means longer vacancies and softer asking-rent achievability than the comps imply.
- What's the recent tenant-quality profile in this submarket — average credit score on applications, eviction rate, late-payment / NSF rate, and stable-employment percentage? A property-management company in the area should have these aggregated.
- How much new for-sale + rental construction is in the pipeline within 1–3 miles? Heavy new supply typically softens prices + rents 12–24 months out; constrained supply supports both.
Investment metrics
- 1% rule
- 4.34% ✓
- Cap rate
- 40.31%
- Cash-on-cash
- 121.47%
- DSCR
- 6.40
- GRM
- 1.9
CMA / ARV
- ARV (on-the-fly)
- $61,908
- Comps found
- 12
Show comp detail 12 sales within ~0.75 mi
| Address | Dist | Beds/Ba | Sqft | Sold | Price | $/sf | Match |
|---|---|---|---|---|---|---|---|
| 1166 Madison Ave #71 | 0.00mi | 2/2.0 | 924 (-2%) | 1mo | $45,000 | $49 | 97 |
| 1535 Sunset Pl #32 | 0.09mi | 2/2.0 | 924 (-2%) | 7mo | $47,500 | $51 | 88 |
| 1166 N Madison Ave #243 | 0.00mi | 2/2.0 | 992 (+6%) | 12mo | $60,000 | $60 | 80 |
| 1519 Sunset Pl #34 | 0.09mi | 3/2.0 (+1) | 924 (-2%) | 10mo | $37,500 | $41 | 80 |
| 1166 Madison Ave #130 | 0.00mi | 2/1.0 | 896 (-4%) | 12mo | $47,500 | $53 | 79 |
| 1700 Pearl Dr #106 | 0.25mi | 2/2.0 | 896 (-4%) | 3mo | $60,000 | $67 | 78 |
| 1367 Sylmar Pl #11 | 0.10mi | 3/2.0 (+1) | 960 (+2%) | 10mo | $92,000 | $96 | 78 |
| 1850 Sandstone Ct #84 | 0.35mi | 2/1.0 | 960 (+2%) | 7mo | $70,000 | $73 | 70 |
| 1166 Madison Ave #203 | 0.00mi | 2/1.5 | 1,072 (+14%) | 7mo | $72,500 | $68 | 68 |
| 1826 Sandstone Ct #86 | 0.33mi | 3/1.0 (+1) | 980 (+4%) | 0mo | $115,000 | $117 | 68 |
| 1773 Sandstone Dr #131 | 0.29mi | 2/2.0 | 1,024 (+9%) | 11mo | $68,000 | $66 | 62 |
| 1500 Sylmar Pl #701 | 0.12mi | 3/2.0 (+1) | 1,064 (+13%) | 6mo | $34,000 | $32 | 62 |
Match score weights: distance 35% · size 25% · config 20% · recency 20%. Top-matched comps best support the ARV.
Projected returns pro-forma
-3.0% appreciation · 3.57% rent growth · sell at horizon
- IRR
- —
- Equity multiple
- 6.96×
- Total profit
- $58,389
- Equity at exit
- $5,219
- IRR
- —
- Equity multiple
- 14.86×
- Total profit
- $135,844
- Equity at exit
- $3,026
Cash invested: $9,800 (down + closing). Projections, not guarantees.
Landlord ↔ Tenant lean methodology
- Overall (STATE)
- 38 Tenant-Leaning
- State Colorado
- 38 Tenant-Leaning · D+4
- County
- — inherits STATE
- City
- — inherits STATE
ZIP-level market 80537
- Rents YoY
- 3.6%
- Active inventory
- 283
- Price-to-rent
- 1.9×
Monthly cashflow live
- Estimated rent
- $1,518 high interval (Pro) →
- Mortgage (P&I)
- −$184
- Tax from tax record
- −$9 /mo · $111/yr
- Insurance
- −$15
- HOA
- −$0
- Vacancy / Maint / Mgmt
- −$319
- Net cashflow
- $992
Break-even live
UW: 25.0% down · 7.5% · 30yr · 1.5% tax · 5.0% vac · 8.0% maint · 8.0% mgmt
Financing live
Cash to close
- Down payment
- $8,750
- Closing costs
- $1,050
- Reserves months
- —
- Total cash needed
- —
Loan-product check · same deal, 3 products live
Conventional
25% down · 7.5% · 30yr
- Down + closing
- —
- Monthly P&I
- —
- Monthly cashflow
- —
- DSCR
- —
- Eligible?
- —
Personal DTI + credit; lowest rate.
DSCR
20% down · 8.5% · 30yr
- Down + closing
- —
- Monthly P&I
- —
- Monthly cashflow
- —
- DSCR
- —
- Eligible?
- —
No personal income docs; deal must DSCR.
Hard money
10% down · 12.0% · 12mo
- Down + closing
- —
- Monthly P&I
- —
- Monthly cashflow
- —
- DSCR
- —
- Eligible?
- —
Short-term bridge; refi at stabilization.
Rent comps 34 comps
| Address | Beds | Baths | Sqft | Rent | $/sqft | DOM | Units | Dist |
|---|---|---|---|---|---|---|---|---|
| 1302 Nickel Dr Unit 1 Loveland, CO | 3.0 | 1.0 | 950 | $1,300 | $1.37 | 23d | 1 | 0.08mi |
| 1710 E 16th St Loveland, CO | 2.0 | 1.5 | 900 | $1,427 | $1.59 | 23d | 1 | 0.38mi |
| 1706 E 16th St Unit 1710 Loveland, CO | 2.0 | 1.5 | 900 | $1,250 | $1.39 | 23d | 1 | 0.39mi |
| 1707 E 16th St Unit 1717 Loveland, CO | 2.0 | 1.5 | 825 | $1,295 | $1.57 | 13d | 1 | 0.41mi |
| 1338 E 7th St Loveland, CO | 2.0 | 1.0 | 598 | $1,695 | $2.83 | 13d | 1 | 0.47mi |
| 1840 E 17th St Unit 1840 Loveland, CO | 3.0 | 1.0 | 1000 | $1,345 | $1.34 | 13d | 1 | 0.50mi |
| 1707 Cheyenne Ave Unit 8 Loveland, CO | 2.0 | 1.0 | 820 | $1,245 | $1.52 | 23d | 1 | 0.52mi |
| 1640 Cheyenne Ave Loveland, CO | 2.0 | 1.0 | 900 | $1,900 | $2.11 | 23d | 1 | 0.54mi |
| 1292 E 6th St Loveland, CO | 1.0–3.0 | 1.0–1.5 | 845 | $1,729 | $2.05 | 13d | 1 | 0.56mi |
| 1494 E 5th St Loveland, CO | 2.0 | 1.0 | 800 | $1,525 | $1.91 | 23d | 1 | 0.60mi |
| 1492 E 5th St Loveland, CO | 1.0 | 1.0 | 800 | $1,350 | $1.69 | 23d | 1 | 0.60mi |
| 1143 E 5th St Loveland, CO | 2.0 | 1.0 | 760 | $1,250 | $1.64 | 23d | 1 | 0.61mi |
| 1145 E 5th St Loveland, CO | 2.0 | 1.0 | 760 | $1,250 | $1.64 | 23d | 1 | 0.61mi |
| 1054 E 5th St Loveland, CO | 3.0 | 1.0 | 1090 | $1,700 | $1.56 | 13d | 1 | 0.71mi |
| 1325 N Jefferson Ave Loveland, CO | 2.0 | 1.0 | 850 | $1,545 | $1.82 | 23d | 1 | 0.80mi |
| 339 E 10th St Loveland, CO | 1.0 | 1.0 | 576 | $1,358 | $2.36 | 21d | 3 | 0.81mi |
| 574 E 23rd St Loveland, CO | 2.0 | 1.0 | 956 | $1,250 | $1.31 | 23d | 5 | 0.99mi |
| 325 E 5th St Loveland, CO | 3.0 | 1.0–2.0 | 1188 | $2,045 | $1.72 | 13d | 1 | 1.00mi |
| 347 N Washington Ave Loveland, CO | 1.0 | 1.0 | 650 | $1,195 | $1.84 | 23d | 1 | 1.00mi |
| 347 N Washington Ave Loveland, CO | 1.0 | 1.0 | 650 | $1,195 | $1.84 | 13d | 1 | 1.00mi |
| 585 N Lincoln Ave Loveland, CO | 1.0–2.0 | 1.0–2.0 | 747 | $1,750 | $2.34 | 23d | 3 | 1.03mi |
| 247 W 10th St Loveland, CO | 2.0 | 2.0 | 865 | $2,500 | $2.89 | 21d | 1 | 1.15mi |
| 331 N Cleveland Ave Unit 220 Loveland, CO | 2.0 | 1.0 | 625 | $1,400 | $2.24 | 23d | 1 | 1.16mi |
| 246 N Cleveland Ave Loveland, CO | 3.0 | 1.0–2.0 | 1022 | $2,544 | $2.49 | 13d | 11 | 1.18mi |
| 2900 Mountain Lion Dr Loveland, CO | 3.0 | 1.0–2.0 | 936 | $2,048 | $2.19 | 13d | 17 | 1.22mi |
| 130 E 1st St Loveland, CO | 2.0 | 1.0 | 800 | $1,695 | $2.12 | 23d | 1 | 1.31mi |
| 140 E 1st St Loveland, CO | 2.0 | 2.0 | 875 | $1,795 | $2.05 | 13d | 1 | 1.31mi |
| 256 S Cleveland Ave Loveland, CO | 1.0 | 1.0 | 600 | $1,395 | $2.33 | 23d | 1 | 1.35mi |
| 430 W 10th St Loveland, CO | 2.0 | 1.0 | 756 | $1,400 | $1.85 | 23d | 1 | 1.35mi |
| 434 W 10th St Loveland, CO | 2.0 | 1.0 | 872 | $1,400 | $1.61 | 23d | 1 | 1.35mi |
| 260 S Cleveland Ave Loveland, CO | 1.0 | 1.0 | 600 | $1,395 | $2.33 | 23d | 1 | 1.35mi |
| 466 W 10th St Loveland, CO | 2.0 | 1.0 | 840 | $1,400 | $1.67 | 23d | 1 | 1.38mi |
| 480 W 10th St Loveland, CO | 2.0 | 2.0 | 940 | $1,700 | $1.81 | 23d | 1 | 1.39mi |
| 1015 Roosevelt Ave Unit B1 Loveland, CO | 2.0 | 1.0 | 900 | $1,500 | $1.67 | 23d | 1 | 1.41mi |
Listing history 19 events
-
2026-06-18days on market $35,000 Active 48 DOM
-
2026-06-17days on market $35,000 Active 47 DOM
-
2026-06-16days on market $35,000 Active 46 DOM
-
2026-06-15days on market $35,000 Active 45 DOM
-
2026-06-14days on market $35,000 Active 43 DOM
-
2026-06-13days on market $35,000 Active 42 DOM
-
2026-06-10days on market $35,000 Active 40 DOM
-
2026-06-09days on market $35,000 Active 39 DOM
-
2026-06-08days on market $35,000 Active 38 DOM
-
2026-06-07days on market $35,000 Active 37 DOM
-
2026-06-03days on market $35,000 Active 33 DOM
-
2026-06-02days on market $35,000 Active 32 DOM
-
2026-06-01days on market $35,000 Active 31 DOM
-
2026-05-31days on market $35,000 Active 30 DOM
-
2026-05-30days on market $35,000 Active 29 DOM
-
2026-05-01price $35,000
-
2026-05-01$30,000 Active
-
2026-04-10historical
-
2025-10-10$35,000 Active
ⓘ Source: listings_history table (triggers on properties + properties_extension) + one-shot
backfill from property_details.listing_events for pre-trigger history.
Tax reassessment forecast CO · Resets to sale price
- Current annual tax
- $111 · $9/mo
- Projected year-2 tax
- $192 · $16/mo
- Expected delta
- +$82/yr (+$7/mo · 74.0%)
ⓘ Screening estimate from a state-policy table — verify with the county assessor before closing.
Climate risk First Street
- Flood 1/10 Low FEMA zone X (unshaded) · 0% chance over 30 yrs
- Wildfire 5/10 Major
- Heat 3/10 Moderate 7 d/yr ≥92°F today · 19 d/yr by 30 yrs out
- Wind 1/10 Low
- Air quality 4/10 Moderate 6 unhealthy d/yr today · 8 by 30 yrs out
Nearby sold comps map
Loading sold comps map…
Walkable amenities ~0.75 mi
Loading nearby amenities…
Taxation est. · year 1
- Rental income
- $18,218
- − Mortgage interest
- −$1,961
- − Property taxes
- −$111
- − Insurance
- −$175
- − Repairs & maintenance
- −$1,457
- − Management
- −$1,457
- − Depreciation
- −$1,018
- Taxable income
- $12,039
- Est. tax owed @ 24.0%
- −$2,889
- After-tax cash flow
- $9,015/yr
For passive investors: Depreciation is non-cash, so a rental often shows a tax loss while cash-flowing — sheltering income. Rental losses are passive: they offset passive income freely, and up to $25,000/yr can offset ordinary (W-2) income if you actively participate and your MAGI is under $100k (phasing out to $0 by $150k); unused losses carry forward. On sale, claimed depreciation is recaptured at up to 25%, and gains may owe capital-gains tax (a 1031 exchange can defer both). Figures are a year-1 estimate at your 24.0% rate — not tax advice; consult a CPA.
Schools (NCES district)
- District
- Thompson School District R-2J
- NCES district ID
- 0805400
- Math proficiency
- 28% ▼ -7.00%
- Reading proficiency
- 48% ▬ 0.00%
- Median HH income
- $63,040
- Composite
- 34.01/100
- National rank
- #5313
- State rank
- #28 of 86 in CO
Livability — Loveland
- Score
- 73/100
- State rank
- #52
- US rank
- #5353
Category grades
Schools grade is shown separately in the Schools card above.
Census & demographics
- Census place
- Loveland, CO
- County
- Larimer County · 338,255 people
- City population
- 94,535
- Metro
- Fort Collins, CO
- Population (ZIP)
- 44,425
- Household income
- $86,325
- Rent vs Own
- Severe rent burden
- 1703.0
Population outlook (Larimer County) Hauer SSP2
- Today (2025)
- 415,361 people
- By 2030
- 457,762 · +10.2%
- By 2040
- 542,310 · +30.6%
- By 2050
- 627,048 · +51.0%
- By 2075
- 833,722 · +100.7%
- By 2100
- 952,590 · +129.3%
Race, ethnicity, and origin ACS 2023
- Neighborhood character
- Predominantly White (83%)
- Race & ethnicity
- White 83% Hispanic / Latino 12% Two or more races 8%
- Hispanic origin (detail)
- Mexican 10%
- Common ancestry
- Slovak 4% Italian 3% Lithuanian 3%
- Foreign-born
- 3% · Canada
- Languages at home
- 95% English-only · Spanish 4%
Political lean MEDSL · Larimer
- 2024 margin
- D (+17.6) · D 57.4% · R 39.8% · Other 2.9%
- 2008→2024 swing
- +7.9pp toward D · 2008: 9.7pp · 2024: 17.6pp
- All cycles
- 2024: D+17.6 2020: D+15.4 2016: D+4.9 2012: D+5.2 2008: D+9.7
Not yet ingested
- Civics
- —
Market trends
- HPI YoY
- ▼ -606.26%
- Current HPI
- 253.4939
- Rent YoY
- ▲ 3.57%
- Metro
- Fort Collins, CO
- State GDP YoY
- ▲ 1.95%
- F500 in state
- 14
Industry mix (Fortune 500 HQ in CO)
| Industry | F500 HQs | Revenue |
|---|---|---|
| Technology Distribution | 1 | $31B |
|
||
| Food / Agriculture | 1 | $18B |
|
||
| Packaging | 1 | $14B |
|
||
| Healthcare | 1 | $13B |
|
||
| Energy | 1 | $10B |
|
||
| Technology | 1 | $4B |
|
||
Price history
+0.0% since first listed4 events — show timeline
- 2026-05-01 Price Changed $35,000 IRES
- 2026-05-01 Listed $30,000 IRES
- 2026-04-10 Listing Removed — IRES
- 2025-10-10 Listed $35,000 IRES
Property tax history
+3.1%/yrLatest (2025): $111 · +177.2% YoY. Source: county tax records.
Cash-flow waterfall
monthlySold comps — $/sqft
last 12 mo · ≤1 miLoading sold comps…