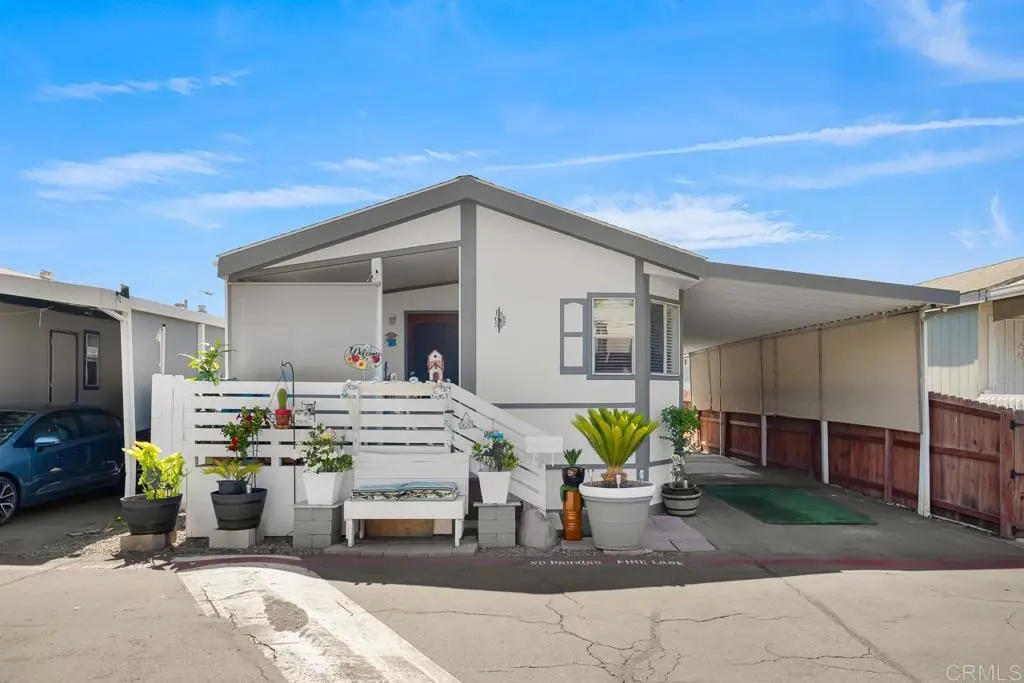
9902 Jamacha Blvd #165
La Presa, CA 91977
$255,000C
3 bd · 2.0 ba ·
1,022 sqft ·
Built 2004
· Manufactured
· Active
· 30 DOM
Cashflow @ list (25.0% down · 7.5%)
Estimated rent
$2,772/mo
Mortgage (P&I)
−$1,337
Tax + insurance
−$204
HOA
−$0
Vac / Maint / Mgmt
−$582
Net cashflow
$648/mo
Annual
$7,780/yr
Cap rate
9.34%
Cash-on-cash
10.90%
DSCR
1.48
1% rule
1.09%
Cash to close
$71,400
Investor read
- This is a 3-bed/2.0-bath manufactured listed at $255k.
- At list price, monthly cash flow is $648 ($8k/yr) — positive.
- The deal already cash-flows at list — no discount required.
- Meets the 1% rule at list price ($3k rent vs $255k).
- It's been on market 30 days — a 2% lower offer ($251k) is reasonable based on typical stale-listing flexibility.
- Recommended offer: $251k (1.5% below list) — sets the bar for market timing.
- Local home prices are declining (-3.0%/yr); year-one equity from $2k of loan paydown is wiped out by about $8k of value loss. Plan a longer hold.
- Location reads 60/100 on livability (#571 in CA) — a middle-class / working-renter tenant base. Strengths: commute A+, employment B, housing B; Watch: schools D+, health & safety D, crime F.
- La Mesa-Spring Valley (suburban): math 41% / reading 53% proficiency, ranked #478 of 1,400 in CA (top 34%) — families likely to look elsewhere, expect single-tenant / working-renter base with shorter leases.
- Market conditions: Rents flat; 160 active listings in the ZIP; 8 comparable units currently listed for rent nearby; rentals leasing fast (median 3d on market — plan ~1-2 weeks tenant-placement turnaround); solid renter incomes; 11,759 units permitted in San Diego County in 2024 (7,244 in 5+ unit buildings).
- San Diego County population projected at +20% by 2050 — long-run rental-demand tailwind backs the buy-and-hold thesis.
- 10 sale attempts since 12y ago with the ask held roughly flat each time — persistent listings suggest the price (not the market) is what's stuck; bring a comps-based counter.
- Current owner paid $70k; list at $255k implies a 264% gain — meaningful room to come down on a strong offer.
- Climate carrying-cost: major wildfire risk; extreme-heat days projected 7→20/yr by 2055 (HVAC capex compounding) — expect insurance premiums to compound above CPI over the hold.
- Cap rate 9.3% vs local median 3.0% in La Presa — top-decile yield for the area; either an underpriced asset or a hidden risk that comps aren't pricing in. Stress-test before assuming the spread holds.
- This rent runs 33% of the median local income ($100k/yr) — at the standard rent-burdened threshold; future hikes will face affordability resistance.
Questions for listing agent
- Is there a deadline driving the sale (1031 exchange, divorce, estate, relocation)? That informs how much negotiation room exists.
- Schools are D-rated, which usually means shorter tenancies and higher turnover. Who's the typical renter profile here, and what's been the actual vacancy rate?
- Crime grade is F in this area — have there been break-ins, vandalism, or insurance claims at this property in the last 3 years? What carrier currently insures it and at what premium?
- This sits on a lake — are riparian / water-frontage rights deeded with the parcel? Any dock permits, shoreline easements, or HOA water-use restrictions?
- What's the documented flood / surge / shoreline-erosion history here (FEMA AND non-FEMA — e.g., storm surge, creek backup, septic-field saturation)?
- Any water-quality or seasonal algae-bloom issues that affect tenant satisfaction or short-term-rental demand?
- What's the average days-on-market for RENTAL listings here right now (not sales)? A rising rental-DOM trend means longer vacancies and softer asking-rent achievability than the comps imply.
- What's the recent tenant-quality profile in this submarket — average credit score on applications, eviction rate, late-payment / NSF rate, and stable-employment percentage? A property-management company in the area should have these aggregated.
CashFlowRE · CFR-RXR4SJBXCDR1N0
· Data 1 h ago
cashflowre.app · 2026-05-29