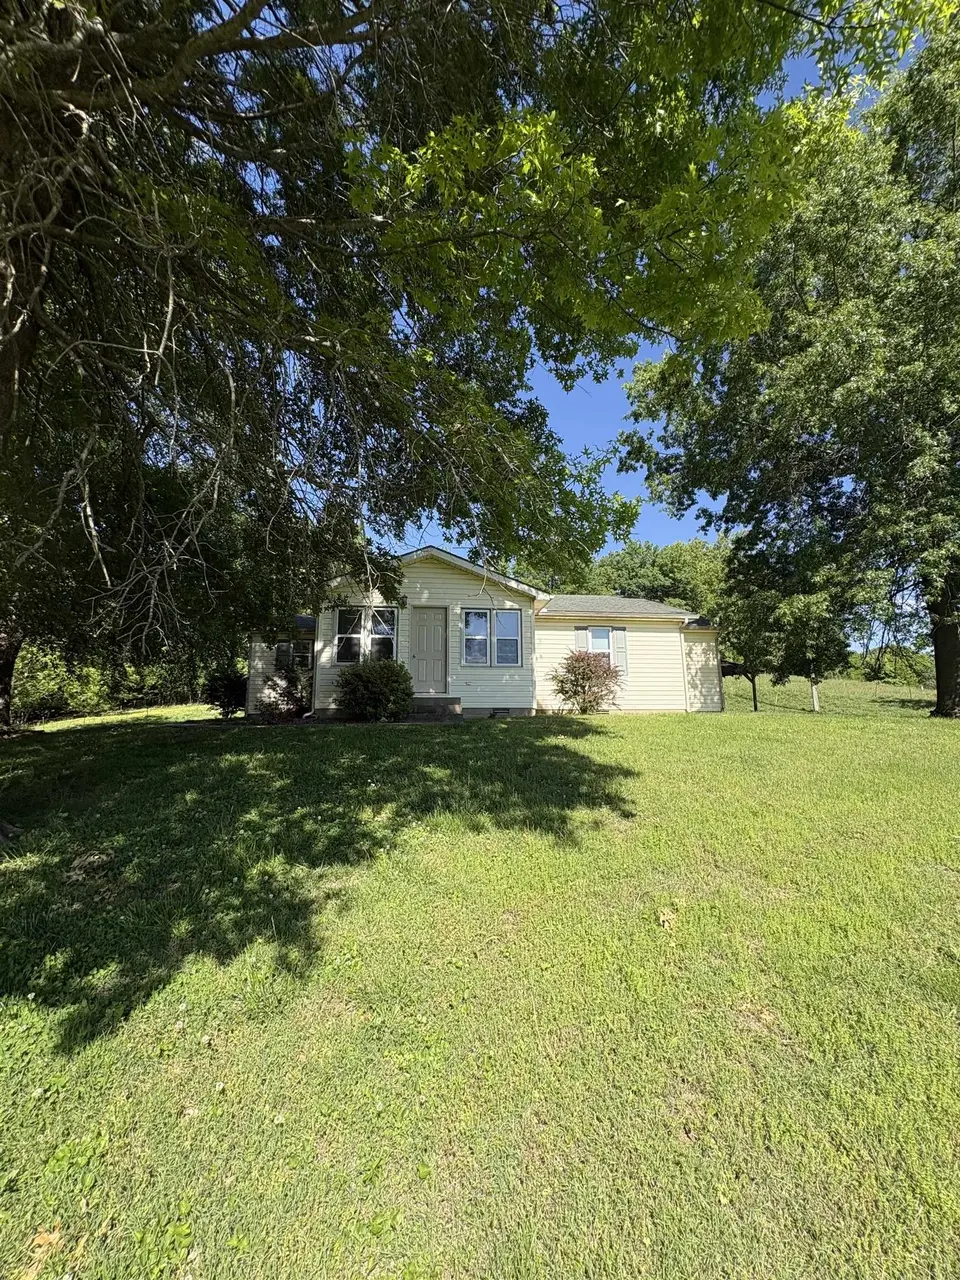
9828 State Route 492
Sturgis, KY 42459
$109,900D
2 bd · 2.0 ba ·
1,004 sqft ·
Built 1970
· SingleFamily
· Pending
Cashflow @ list (25.0% down · 7.5%)
Estimated rent
$926/mo
Mortgage (P&I)
−$576
Tax + insurance
−$183
HOA
−$0
Vac / Maint / Mgmt
−$195
Net cashflow
$-28/mo
Annual
$-333/yr
Cap rate
5.99%
Cash-on-cash
-1.08%
DSCR
0.95
1% rule
0.84%
Cash to close
$30,772
Investor read
- This is a 2-bed/2.0-bath single-family listed at $110k.
- At list price, monthly cash flow is $-28 ($-333/yr) — negative.
- To cash-flow at today's rent, offer at most $106k (3.7% below list).
- To meet the 1% rule (rent ≥ 1% of price), the offer needs to be $93k (15.7% below list).
- Only 0 days on market — expect competitive offers; lowballing is unlikely to land.
- Recommended offer: $93k (15.7% below list) — sets the bar for 1% rule.
- Local home prices are declining (-3.0%/yr); year-one equity from $760 of loan paydown is wiped out by about $3k of value loss. Plan a longer hold.
- Location reads 68/100 on livability (#199 in KY) — a middle-class / working-renter tenant base. Strengths: crime A+, cost of living A+, housing A+; Watch: employment D, amenities F, commute F.
- Union County (rural): math 20% / reading 33% proficiency, ranked #134 of 165 in KY (top 81%) — low school quality limits family demand, transient renter base, plan for 1-2y turnover.
- Zoned schools: Sturgis Elementary School (math 32% / reading 42%, grade F, #255 of 676 statewide, top 42%, 369 students, 60% FRL); Union County Middle School (math 15% / reading 36%, grade F, #181 of 217 statewide, top 84%, 437 students, 58% FRL); Union County High School (math 22% / reading 42%, grade F, #97 of 254 statewide, top 46%, 630 students, 50% FRL) — zoned schools at 56% FRL track the district average.
- Market conditions: 19 active listings in the ZIP.
- Union County population projected at -18% by 2050 — secular population decline; favor cash flow + early exit over multi-decade hold.
- Climate carrying-cost: extreme-heat days projected 7→20/yr by 2055 (HVAC capex compounding) — expect insurance premiums to compound above CPI over the hold.
Questions for listing agent
- What do current leases actually rent for vs. the listed asking? Can we see a recent rent roll and the last 12 months of T-12 income?
- Built in 1970 — when were the roof, HVAC, electrical panel, plumbing, and water heater last replaced?
- Is there a deadline driving the sale (1031 exchange, divorce, estate, relocation)? That informs how much negotiation room exists.
- Schools are D-rated, which usually means shorter tenancies and higher turnover. Who's the typical renter profile here, and what's been the actual vacancy rate?
- The area grade is low — what's the realistic commute time and amenity access for the typical tenant pool here? Any planned neighborhood developments (good or bad) we should know about?
- What's the average days-on-market for RENTAL listings here right now (not sales)? A rising rental-DOM trend means longer vacancies and softer asking-rent achievability than the comps imply.
- What's the recent tenant-quality profile in this submarket — average credit score on applications, eviction rate, late-payment / NSF rate, and stable-employment percentage? A property-management company in the area should have these aggregated.
- How much new for-sale + rental construction is in the pipeline within 1–3 miles? Heavy new supply typically softens prices + rents 12–24 months out; constrained supply supports both.
CashFlowRE · CFR-RY3Q2MD4DZ7WAC
· Data 3 weeks ago
cashflowre.app · 2026-05-29