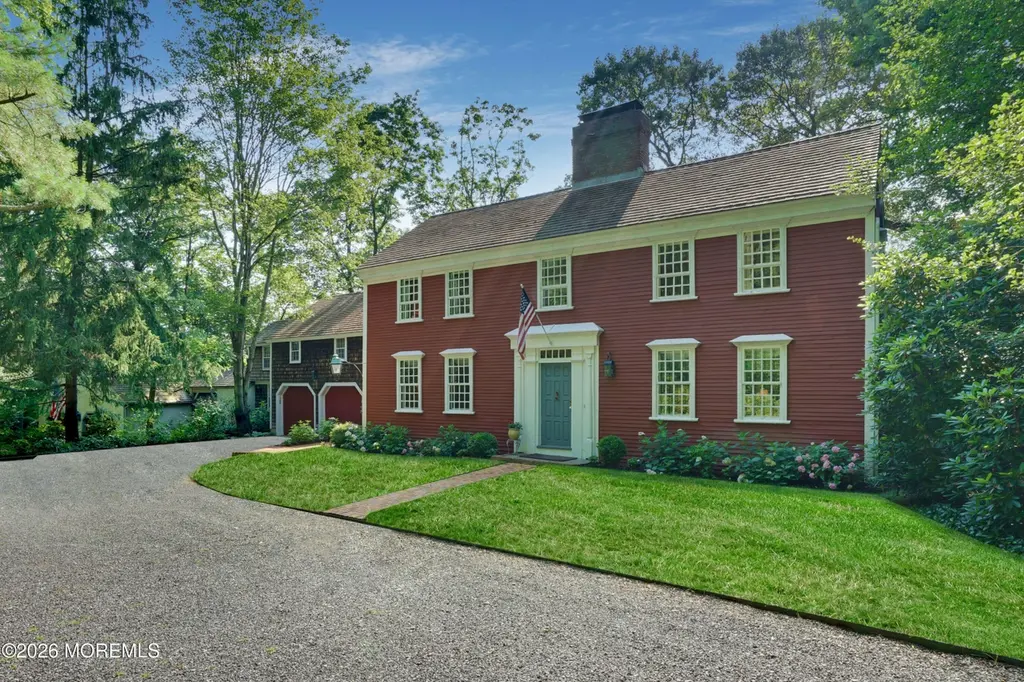
946 Navesink River Rd
Rumson, NJ 07760
$2,100,000D
5 bd · 4.5 ba ·
4,526 sqft ·
Built 1963
· SingleFamily
· Pending
· 15 DOM
Cashflow @ list (25.0% down · 7.5%)
Estimated rent
$17,934/mo
Mortgage (P&I)
−$11,013
Tax + insurance
−$2,597
HOA
−$0
Vac / Maint / Mgmt
−$3,766
Net cashflow
$558/mo
Annual
$6,700/yr
Cap rate
6.61%
Cash-on-cash
1.14%
DSCR
1.05
1% rule
0.85%
Cash to close
$588,000
Investor read
- This is a 5-bed/4.5-bath single-family listed at $2.10M.
- At list price, monthly cash flow is $558 ($7k/yr) — positive.
- The deal already cash-flows at list — no discount required.
- To meet the 1% rule (rent ≥ 1% of price), the offer needs to be $1.79M (14.6% below list).
- It's been on market 15 days — a 2% lower offer ($2.07M) is reasonable based on typical stale-listing flexibility.
- Recommended offer: $1.79M (14.6% below list) — sets the bar for 1% rule.
- Local home prices are declining (-3.0%/yr); year-one equity from $15k of loan paydown is wiped out by about $63k of value loss. Plan a longer hold.
- Location reads 67/100 on livability (#326 in NJ) — a middle-class / working-renter tenant base. Strengths: schools A+, crime A+, employment A+; Watch: amenities F, commute F, cost of living F.
- Middletown Township Public School District (suburban): math 39% / reading 55% proficiency, ranked #135 of 472 in NJ (top 29%) — families likely to look elsewhere, expect single-tenant / working-renter base with shorter leases; only 9% free/reduced lunch — higher-income household profile.
- Market conditions: 80 active listings in the ZIP; 3 comparable units currently listed for rent nearby; rentals at typical pace (median 15d on market — plan ~3-4 weeks tenant-placement turnaround); 2,840 units permitted in Monmouth County in 2024 (484 in 5+ unit buildings).
- Monmouth County population projected at -11% by 2050 — secular population decline; favor cash flow + early exit over multi-decade hold.
- 2 sale attempts since 5y ago with the ask held roughly flat each time — persistent listings suggest the price (not the market) is what's stuck; bring a comps-based counter.
- Current owner paid $950k; list at $2.10M implies a 121% gain — meaningful room to come down on a strong offer.
- Climate carrying-cost: severe wind risk, 80% chance of damaging wind over 30y; extreme-heat days projected 7→16/yr by 2055 (HVAC capex compounding) — expect insurance premiums to compound above CPI over the hold.
- Cap rate 6.6% vs local median 3.6% in Rumson — top-decile yield for the area; either an underpriced asset or a hidden risk that comps aren't pricing in. Stress-test before assuming the spread holds.
Questions for listing agent
- Built in 1963 — when were the roof, HVAC, electrical panel, plumbing, and water heater last replaced?
- Is there a deadline driving the sale (1031 exchange, divorce, estate, relocation)? That informs how much negotiation room exists.
- Schools are A-rated — typically a magnet for longer-tenancy family renters. What's the average tenant stay here, and is there a school-zone premium baked into asking?
- The area grade is low — what's the realistic commute time and amenity access for the typical tenant pool here? Any planned neighborhood developments (good or bad) we should know about?
- What's the average days-on-market for RENTAL listings here right now (not sales)? A rising rental-DOM trend means longer vacancies and softer asking-rent achievability than the comps imply.
- What's the recent tenant-quality profile in this submarket — average credit score on applications, eviction rate, late-payment / NSF rate, and stable-employment percentage? A property-management company in the area should have these aggregated.
- How much new for-sale + rental construction is in the pipeline within 1–3 miles? Heavy new supply typically softens prices + rents 12–24 months out; constrained supply supports both.
CashFlowRE · CFR-RYGNCWD0SRWEP2
· Data 3 weeks ago
cashflowre.app · 2026-05-29