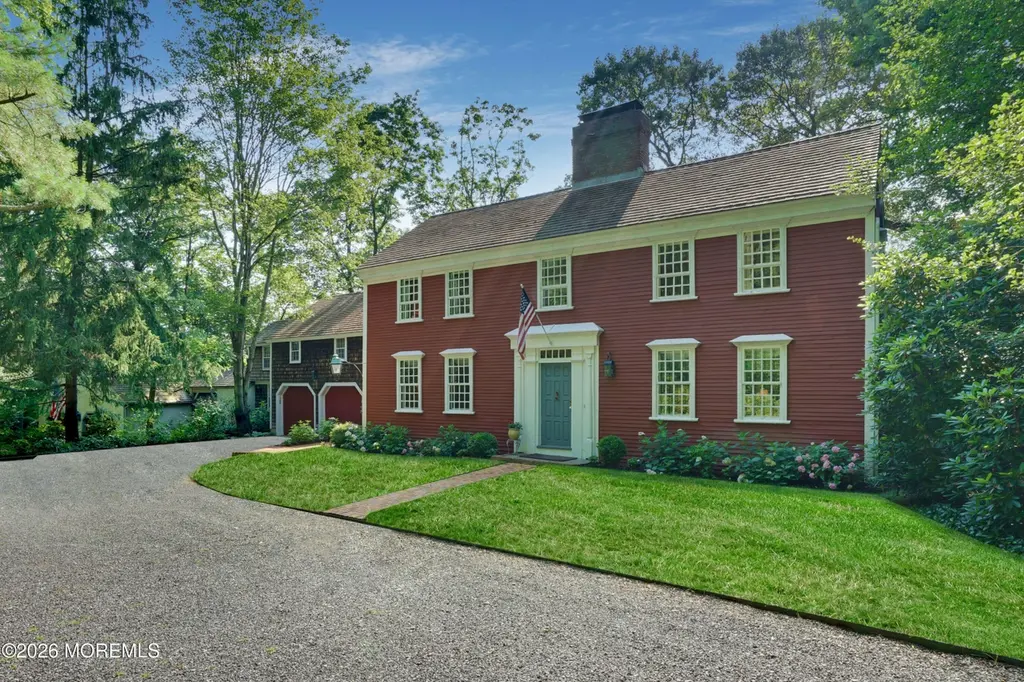
946 Navesink River Rd · Rumson, NJ
Flood risk 1/10 · Minimal
- FEMA flood zone
- X (unshaded)
- Chance of flooding over 30 yrs
- 0.0%
- Est. flood insurance / yr
- $507 – $1,088
Fire risk 3/10 · Minor
- Est. fire insurance / yr
- $526 – $976
Heat risk 7/10 · Major
- Hot days now (above 95°F)
- 7 days/yr
- Hot days in 30 yrs
- 16 days/yr
Wind risk 8/10 · Major
- Chance of severe wind over 30 yrs
- 80.0%
Air-quality risk 4/10 · Minor
- Unhealthy air days now
- 3 days/yr
- Unhealthy air days in 30 yrs
- 5 days/yr
Risk factors via First Street. Map © Google.
Why this score? — see what drove the D grade
The composite is a weighted blend of 9 inputs, each scored 0–100. Each bar is that input's sub-score; the figure is the points it added to the 100-point composite (weight × sub-score).
- Cash flow +14.8/30.0
- ARV discount +7.5/15.0
- DSCR +4.5/10.0
- Schools +4.5/10.0
- 1% rule +3.5/10.0
- Livability +3.4/5.0
- Rent growth +2.5/5.0
- Condition / age +2.5/5.0
- Appreciation +0.0/10.0
$2,100,000
🖨 Deal sheet 📄 Offer letter ✓ Due diligence
Listing remarks
''The Nathaniel Smith House'', built in the early 1700's in Massachusetts, was reassembled from its original materials on site, expanded and updated over the years. With views of the Navesink River, this 4,526 sq. ft. house with 5-6 bedrooms, 4.5 baths sits on a 2.14 acre lot which includes an income producing 1,000 sq. ft. ranch house. If you're looking for charm and character in a country setting and want to awake the feeling of a County Inn in New England, this property will especially appeal to lovers of historic homes. A unique offering with original wide-plank floors, wood paneling, rafter ceilings, 5 wood-burning fireplaces, 3 car garage, generator, first floor master bedroom suite a
Key facts
- Rafter ceilings
- Navesink river views
- Wood paneling
Tags
Property features AI
Exterior
- Parking: Attached 3-car garage
- Security: Security system
- Utilities: Septic tank
- Home design: Single-family residence
- Construction: Crawl space / partial basement
- Exterior features: Shingle, flat and wood roof elements; Riverview property; Level topography
Interior
- Kitchen: Countertop range; Dishwasher; Microwave; Refrigerator; Garbage disposal
- Bedrooms: 5 bedrooms (some located on the second floor)
- Flooring: Ceramic tile; Laminate; Wood
- Bathrooms: 4 full bathrooms; 1 half bathroom
- Heating & cooling: Electric heating with forced air; 3+ zoned heating; Central air conditioning; 3+ zoned AC
- Interior features: Outdoor lighting; Track lighting; Blinds / shades; Ceiling fans; Countertop range; Garbage disposal; Garage door opener; Generator; Security system; Awnings
- Laundry & utility: Washer; Dryer; Laundry room on the first floor
Neighborhood map
What this means for you Summary
Snapshot
- This is a 5-bed/4.5-bath single-family listed at $2.10M.
Deal economics
- At list price, monthly cash flow is $558 ($7k/yr) — positive.
- The deal already cash-flows at list — no discount required.
- To meet the 1% rule (rent ≥ 1% of price), the offer needs to be $1.79M (14.6% below list).
- Recommended offer: $1.79M (14.6% below list) — sets the bar for 1% rule.
- Cap rate 6.6% vs local median 3.6% in Rumson — top-decile yield for the area; either an underpriced asset or a hidden risk that comps aren't pricing in. Stress-test before assuming the spread holds.
Location & tenants
- Location reads 67/100 on livability (#326 in NJ) — a middle-class / working-renter tenant base. Strengths: schools A+, crime A+, employment A+; Watch: amenities F, commute F, cost of living F.
- Middletown Township Public School District (suburban): math 39% / reading 55% proficiency, ranked #135 of 472 in NJ (top 29%) — families likely to look elsewhere, expect single-tenant / working-renter base with shorter leases; only 9% free/reduced lunch — higher-income household profile.
- Market conditions: 80 active listings in the ZIP; 3 comparable units currently listed for rent nearby; rentals at typical pace (median 15d on market — plan ~3-4 weeks tenant-placement turnaround); 2,840 units permitted in Monmouth County in 2024 (484 in 5+ unit buildings).
Forward outlook
- Local home prices are declining (-3.0%/yr); year-one equity from $15k of loan paydown is wiped out by about $63k of value loss. Plan a longer hold.
- Monmouth County population projected at -11% by 2050 — secular population decline; favor cash flow + early exit over multi-decade hold.
Negotiation context
- It's been on market 15 days — a 2% lower offer ($2.07M) is reasonable based on typical stale-listing flexibility.
- 2 sale attempts since 5y ago with the ask held roughly flat each time — persistent listings suggest the price (not the market) is what's stuck; bring a comps-based counter.
- Current owner paid $950k; list at $2.10M implies a 121% gain — meaningful room to come down on a strong offer.
Risks & watch-outs
- Climate carrying-cost: severe wind risk, 80% chance of damaging wind over 30y; extreme-heat days projected 7→16/yr by 2055 (HVAC capex compounding) — expect insurance premiums to compound above CPI over the hold.
Questions for the listing agent
- Built in 1963 — when were the roof, HVAC, electrical panel, plumbing, and water heater last replaced?
- Is there a deadline driving the sale (1031 exchange, divorce, estate, relocation)? That informs how much negotiation room exists.
- Schools are A-rated — typically a magnet for longer-tenancy family renters. What's the average tenant stay here, and is there a school-zone premium baked into asking?
- The area grade is low — what's the realistic commute time and amenity access for the typical tenant pool here? Any planned neighborhood developments (good or bad) we should know about?
- What's the average days-on-market for RENTAL listings here right now (not sales)? A rising rental-DOM trend means longer vacancies and softer asking-rent achievability than the comps imply.
- What's the recent tenant-quality profile in this submarket — average credit score on applications, eviction rate, late-payment / NSF rate, and stable-employment percentage? A property-management company in the area should have these aggregated.
- How much new for-sale + rental construction is in the pipeline within 1–3 miles? Heavy new supply typically softens prices + rents 12–24 months out; constrained supply supports both.
Investment metrics
- 1% rule
- 0.85% ✗
- Cap rate
- 6.61%
- Cash-on-cash
- 1.14%
- DSCR
- 1.05
- GRM
- 9.8
CMA / ARV
No comps found within radius.
Projected returns pro-forma
-3.0% appreciation · 3.0% rent growth · sell at horizon
- IRR
- -14.5%
- Equity multiple
- 0.48×
- Total profit
- $-305,012
- Equity at exit
- $313,117
- IRR
- -5.8%
- Equity multiple
- 0.62×
- Total profit
- $-220,961
- Equity at exit
- $181,570
Cash invested: $588,000 (down + closing). Projections, not guarantees.
Landlord ↔ Tenant lean methodology
- Overall (STATE)
- 21 Tenant-Leaning
- State New Jersey
- 21 Tenant-Leaning · D+6
- County
- — inherits STATE
- City
- — inherits STATE
ZIP-level market 07760
- Active inventory
- 80
- Price-to-rent
- 9.8×
Monthly cashflow live
- Estimated rent
- $17,934 medium interval (Pro) →
- Mortgage (P&I)
- −$11,013
- Tax from tax record
- −$1,722 /mo · $20,662/yr
- Insurance
- −$875
- HOA
- −$0
- Vacancy / Maint / Mgmt
- −$3,766
- Net cashflow
- $558
Break-even live
UW: 25.0% down · 7.5% · 30yr · 1.5% tax · 5.0% vac · 8.0% maint · 8.0% mgmt
Financing live
Cash to close
- Down payment
- $525,000
- Closing costs
- $63,000
- Reserves months
- —
- Total cash needed
- —
Loan-product check · same deal, 3 products live
Conventional
25% down · 7.5% · 30yr
- Down + closing
- —
- Monthly P&I
- —
- Monthly cashflow
- —
- DSCR
- —
- Eligible?
- —
Personal DTI + credit; lowest rate.
DSCR
20% down · 8.5% · 30yr
- Down + closing
- —
- Monthly P&I
- —
- Monthly cashflow
- —
- DSCR
- —
- Eligible?
- —
No personal income docs; deal must DSCR.
Hard money
10% down · 12.0% · 12mo
- Down + closing
- —
- Monthly P&I
- —
- Monthly cashflow
- —
- DSCR
- —
- Eligible?
- —
Short-term bridge; refi at stabilization.
Rent comps 3 comps
| Address | Beds | Baths | Sqft | Rent | $/sqft | DOM | Units | Dist |
|---|---|---|---|---|---|---|---|---|
| 29 Lafayette St Rumson, NJ | 4.0 | 4.5 | 4033 | $14,000 | $3.47 | 1d | 1 | 0.84mi |
| — Rumson, NJ | 4.0 | 3.5 | 3688 | $35,000 | $9.49 | 22d | 1 | 1.35mi |
| 22 Center St Rumson, NJ | 4.0 | 2.0 | 3500 | $6,700 | $1.91 | 15d | 1 | 1.42mi |
Listing history 5 events
-
2026-04-30status Pending
-
2026-04-15$2,100,000 Active
-
2021-10-07historical
-
2021-06-22$1,998,000 Active
-
2012-02-08soldstatus $950,000
ⓘ Source: listings_history table (triggers on properties + properties_extension) + one-shot
backfill from property_details.listing_events for pre-trigger history.
Tax reassessment forecast NJ · Partial reset (capped growth)
- Current annual tax
- $20,662 · $1,722/mo
- Projected year-2 tax
- $36,476 · $3,040/mo
- Expected delta
- +$15,814/yr (+$1,318/mo · 76.5%)
ⓘ Screening estimate from a state-policy table — verify with the county assessor before closing.
Climate risk First Street
- Flood 1/10 Low FEMA zone X (unshaded) · 0% chance over 30 yrs
- Wildfire 3/10 Moderate
- Heat 7/10 Severe 7 d/yr ≥95°F today · 16 d/yr by 30 yrs out
- Wind 8/10 Severe 80% chance of damaging wind over 30 yrs
- Air quality 4/10 Moderate 3 unhealthy d/yr today · 5 by 30 yrs out
Nearby sold comps map
Loading sold comps map…
Walkable amenities ~0.75 mi
Loading nearby amenities…
Taxation est. · year 1
- Rental income
- $215,208
- − Mortgage interest
- −$117,633
- − Property taxes
- −$20,662
- − Insurance
- −$10,500
- − Repairs & maintenance
- −$17,217
- − Management
- −$17,217
- − Depreciation
- −$61,091
- Taxable loss
- −$29,111
- Est. tax savings @ 24.0%
- +$6,987
- After-tax cash flow
- $13,687/yr
For passive investors: Depreciation is non-cash, so a rental often shows a tax loss while cash-flowing — sheltering income. Rental losses are passive: they offset passive income freely, and up to $25,000/yr can offset ordinary (W-2) income if you actively participate and your MAGI is under $100k (phasing out to $0 by $150k); unused losses carry forward. On sale, claimed depreciation is recaptured at up to 25%, and gains may owe capital-gains tax (a 1031 exchange can defer both). Figures are a year-1 estimate at your 24.0% rate — not tax advice; consult a CPA.
Schools (NCES district)
- District
- Middletown Township Public School District
- NCES district ID
- 3410110
- Math proficiency
- 39% ▼ -13.00%
- Reading proficiency
- 55% ▼ -10.00%
- Median HH income
- $100,708
- Composite
- 45.08/100
- National rank
- #2694
- State rank
- #135 of 472 in NJ
Livability — Rumson
- Score
- 67/100
- State rank
- #326
- US rank
- #10228
Category grades
Schools grade is shown separately in the Schools card above.
Census & demographics
- City population
- 9,557
- Population (ZIP)
- 9,557
Population outlook (Monmouth County) Hauer SSP2
- Today (2025)
- 620,308 people
- By 2030
- 612,309 · -1.3%
- By 2040
- 587,297 · -5.3%
- By 2050
- 551,342 · -11.1%
- By 2075
- 472,934 · -23.8%
- By 2100
- 381,534 · -38.5%
Race, ethnicity, and origin ACS 2023
- Neighborhood character
- Predominantly White (94%)
- Race & ethnicity
- White 94% Hispanic / Latino 3% Two or more races 3%
- Common ancestry
- Romanian 5% Scotch-Irish 3% Italian 3%
- Foreign-born
- 5% · Canada
- Languages at home
- 94% English-only · Other Indo-European 2% Spanish 1% German/W. Germanic 1%
Political lean MEDSL · Monmouth
- 2024 margin
- R (+11.4) · D 43.4% · R 54.8% · Other 1.8%
- 2008→2024 swing
- -7.7pp toward R · 2008: -3.7pp · 2024: -11.4pp
- All cycles
- 2024: R+11.4 2020: R+2.8 2016: R+9.5 2012: R+5.5 2008: R+3.7
Not yet ingested
- Civics
- —
Market trends
- HPI YoY
- ▼ -567.27%
- Current HPI
- 369.2564
- Rent YoY
- —
- Metro
- —
- State GDP YoY
- ▲ 2.05%
- F500 in state
- 34
Industry mix (Fortune 500 HQ in NJ)
| Industry | F500 HQs | Revenue |
|---|---|---|
| Consumer Goods | 3 | $31B |
|
||
| Pharmaceuticals | 2 | $153B |
|
||
| Technology | 2 | $21B |
|
||
| Insurance | 2 | $20B |
|
||
| Healthcare | 2 | $19B |
|
||
| Financial Services | 1 | $70B |
|
||
Price history
+121.1% since first listed5 events — show timeline
- 2026-04-30 Pending — MOMLS
- 2026-04-15 Listed $2,100,000 MOMLS
- 2021-10-07 Delisted — MOMLS
- 2021-06-22 Listed $1,998,000 MOMLS
- 2012-02-08 Sold (Public Records) $950,000 Public Records
Property tax history
-0.2%/yrLatest (2025): $20,662 · +8.4% YoY. Source: county tax records.
Cash-flow waterfall
monthlySold comps — $/sqft
last 12 mo · ≤1 miLoading sold comps…