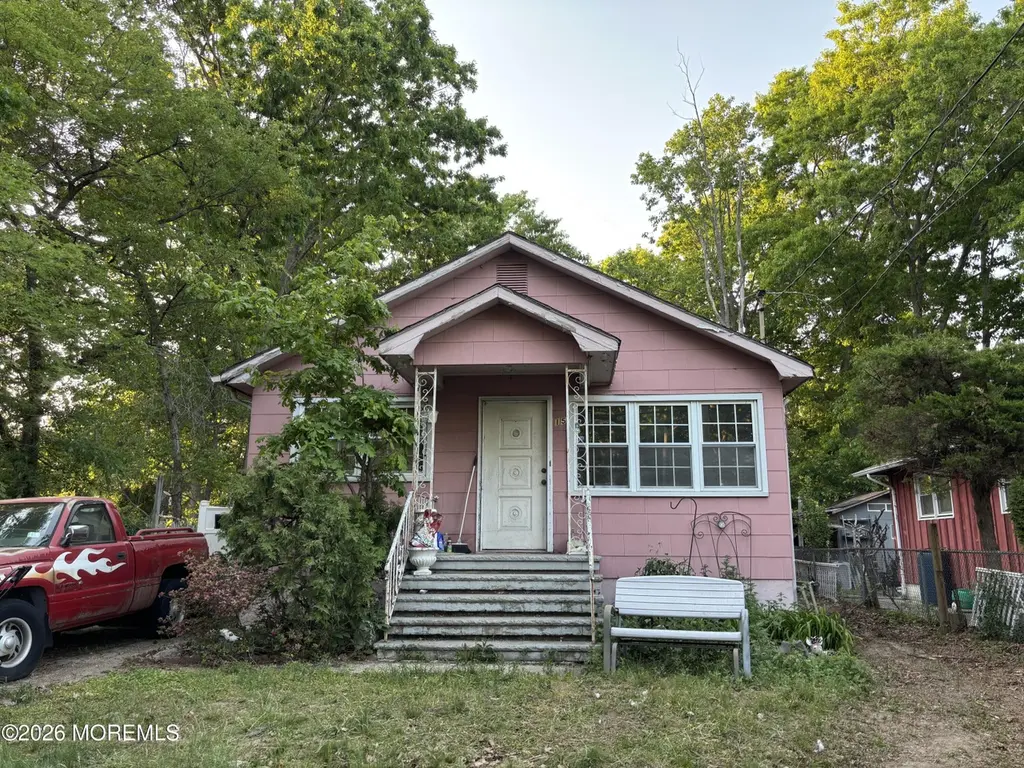
15 E 1st St
West Freehold, NJ 07731
$300,000C+
3 bd · 2.0 ba ·
920 sqft ·
Built 1970
· SingleFamily
· Pending
· 15 DOM
Cashflow @ list (25.0% down · 7.5%)
Estimated rent
$3,367/mo
Mortgage (P&I)
−$1,573
Tax + insurance
−$593
HOA
−$0
Vac / Maint / Mgmt
−$707
Net cashflow
$494/mo
Annual
$5,927/yr
Cap rate
8.27%
Cash-on-cash
7.06%
DSCR
1.31
1% rule
1.12%
Cash to close
$84,000
Investor read
- This is a 3-bed/2.0-bath single-family listed at $300k.
- At list price, monthly cash flow is $494 ($6k/yr) — positive.
- The deal already cash-flows at list — no discount required.
- Meets the 1% rule at list price ($3k rent vs $300k).
- It's been on market 15 days — a 2% lower offer ($296k) is reasonable based on typical stale-listing flexibility.
- Recommended offer: $296k (1.5% below list) — sets the bar for market timing.
- Local home prices are declining (-3.0%/yr); year-one equity from $2k of loan paydown is wiped out by about $9k of value loss. Plan a longer hold.
- Location reads 74/100 on livability (#173 in NJ, #4,542 nationally) — a middle-class / working-renter tenant base. Strengths: employment A+, housing A+, health & safety A+; Watch: amenities F, commute F, cost of living F.
- Howell Township Public School District (suburban): math 30% / reading 52% proficiency, ranked #195 of 472 in NJ (top 41%) — families likely to look elsewhere, expect single-tenant / working-renter base with shorter leases; only 12% free/reduced lunch — higher-income household profile.
- Market conditions: Rents rising (+1.5%/yr); 331 active listings in the ZIP; 2 comparable units currently listed for rent nearby; high-income renter base; 2,840 units permitted in Monmouth County in 2024 (484 in 5+ unit buildings).
- Monmouth County population projected at -11% by 2050 — secular population decline; favor cash flow + early exit over multi-decade hold.
- 2 sale attempts since 16y ago; this cycle's ask has dropped $350k (54%) from the opening price — seller is motivated, your offer sets the floor, not the list.
- Current owner paid $152k; list at $300k implies a 97% gain — meaningful room to come down on a strong offer.
- Climate carrying-cost: major wind risk, 56% chance of damaging wind over 30y; extreme-heat days projected 7→15/yr by 2055 (HVAC capex compounding) — expect insurance premiums to compound above CPI over the hold.
- Cap rate 8.3% vs local median 2.6% in West Freehold — top-decile yield for the area; either an underpriced asset or a hidden risk that comps aren't pricing in. Stress-test before assuming the spread holds.
- This rent runs 30% of the median local income ($134k/yr) — at the standard rent-burdened threshold; future hikes will face affordability resistance.
Questions for listing agent
- Built in 1970 — when were the roof, HVAC, electrical panel, plumbing, and water heater last replaced?
- Is there a deadline driving the sale (1031 exchange, divorce, estate, relocation)? That informs how much negotiation room exists.
- Schools are B-rated — typically a magnet for longer-tenancy family renters. What's the average tenant stay here, and is there a school-zone premium baked into asking?
- What's the average days-on-market for RENTAL listings here right now (not sales)? A rising rental-DOM trend means longer vacancies and softer asking-rent achievability than the comps imply.
- What's the recent tenant-quality profile in this submarket — average credit score on applications, eviction rate, late-payment / NSF rate, and stable-employment percentage? A property-management company in the area should have these aggregated.
- How much new for-sale + rental construction is in the pipeline within 1–3 miles? Heavy new supply typically softens prices + rents 12–24 months out; constrained supply supports both.
CashFlowRE · CFR-RZMSKW1KGHC4KA
· Data 6 days ago
cashflowre.app · 2026-05-29