15 E 1st St · West Freehold, NJ
Flood risk 1/10 · Minimal
- FEMA flood zone
- X (unshaded)
- Chance of flooding over 30 yrs
- 0.0%
- Est. flood insurance / yr
- $473 – $860
Fire risk 2/10 · Minimal
- Est. fire insurance / yr
- $526 – $976
Heat risk 6/10 · Moderate
- Hot days now (above 100°F)
- 7 days/yr
- Hot days in 30 yrs
- 15 days/yr
Wind risk 6/10 · Moderate
- Chance of severe wind over 30 yrs
- 56.0%
Air-quality risk 4/10 · Minor
- Unhealthy air days now
- 4 days/yr
- Unhealthy air days in 30 yrs
- 5 days/yr
Risk factors via First Street. Map © Google.
Why this score? — see what drove the C+ grade
The composite is a weighted blend of 9 inputs, each scored 0–100. Each bar is that input's sub-score; the figure is the points it added to the 100-point composite (weight × sub-score).
- Cash flow +22.3/30.0
- ARV discount +15.0/15.0
- DSCR +7.1/10.0
- 1% rule +6.2/10.0
- Schools +3.9/10.0
- Livability +3.7/5.0
- Rent growth +2.9/5.0
- Condition / age +2.5/5.0
- Appreciation +0.0/10.0
$300,000
🖨 Deal sheet 📄 Offer letter ✓ Due diligence
Listing remarks MLS
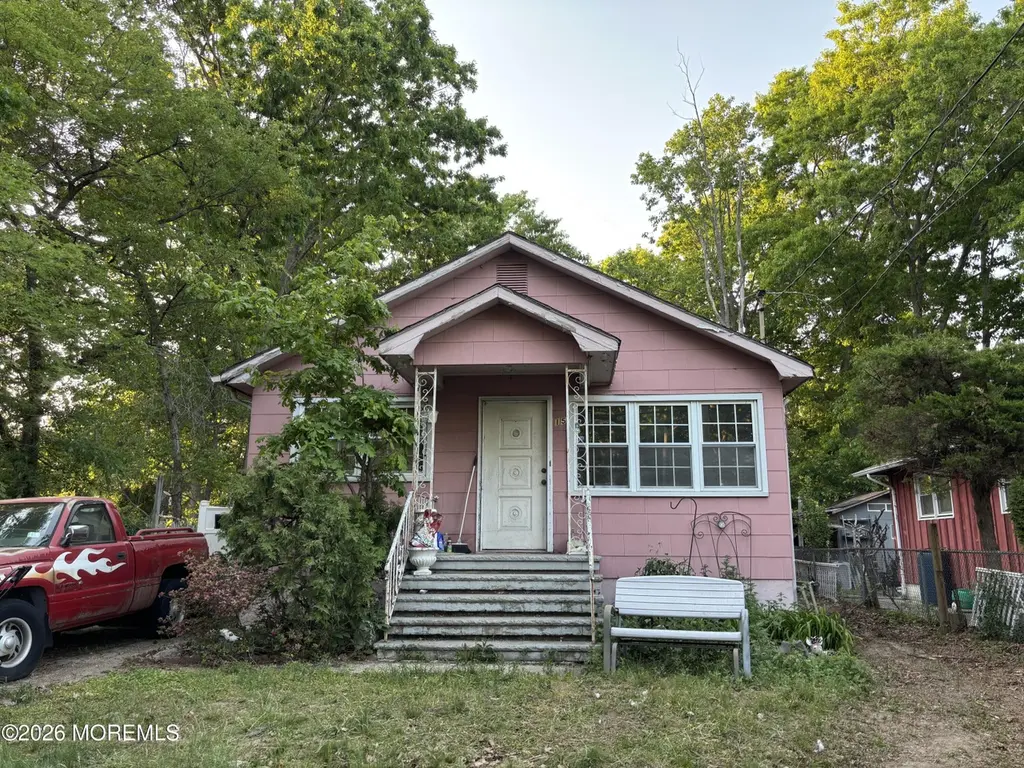
2 BEDROOM, 2 BATH HOUSE W/ FINISHED BASEMENT, being sold as is . LARGE BACKYARD, CONVENIENT TO 195, ROUT 9, PARKS AND SHOPPING. ,SOLD IN AS IS CONDITION, CERT. OF OCC BUYER'S RESPONSIBILITY.
Key facts
- Hardwood flooring
- Separate entrance
- Backyard patio
Tags
Neighborhood map
What this means for you Summary
Snapshot
- This is a 3-bed/2.0-bath single-family listed at $300k.
Deal economics
- At list price, monthly cash flow is $494 ($6k/yr) — positive.
- The deal already cash-flows at list — no discount required.
- Meets the 1% rule at list price ($3k rent vs $300k).
- Recommended offer: $296k (1.5% below list) — sets the bar for market timing.
- Cap rate 8.3% vs local median 2.6% in West Freehold — top-decile yield for the area; either an underpriced asset or a hidden risk that comps aren't pricing in. Stress-test before assuming the spread holds.
Location & tenants
- Location reads 74/100 on livability (#173 in NJ, #4,542 nationally) — a middle-class / working-renter tenant base. Strengths: employment A+, housing A+, health & safety A+; Watch: amenities F, commute F, cost of living F.
- Howell Township Public School District (suburban): math 30% / reading 52% proficiency, ranked #195 of 472 in NJ (top 41%) — families likely to look elsewhere, expect single-tenant / working-renter base with shorter leases; only 12% free/reduced lunch — higher-income household profile.
- Market conditions: Rents rising (+1.5%/yr); 331 active listings in the ZIP; 2 comparable units currently listed for rent nearby; high-income renter base; 2,840 units permitted in Monmouth County in 2024 (484 in 5+ unit buildings).
- This rent runs 30% of the median local income ($134k/yr) — at the standard rent-burdened threshold; future hikes will face affordability resistance.
Forward outlook
- Local home prices are declining (-3.0%/yr); year-one equity from $2k of loan paydown is wiped out by about $9k of value loss. Plan a longer hold.
- Monmouth County population projected at -11% by 2050 — secular population decline; favor cash flow + early exit over multi-decade hold.
Negotiation context
- It's been on market 15 days — a 2% lower offer ($296k) is reasonable based on typical stale-listing flexibility.
- 2 sale attempts since 16y ago; this cycle's ask has dropped $350k (54%) from the opening price — seller is motivated, your offer sets the floor, not the list.
- Current owner paid $152k; list at $300k implies a 97% gain — meaningful room to come down on a strong offer.
Risks & watch-outs
- Climate carrying-cost: major wind risk, 56% chance of damaging wind over 30y; extreme-heat days projected 7→15/yr by 2055 (HVAC capex compounding) — expect insurance premiums to compound above CPI over the hold.
Questions for the listing agent
- Built in 1970 — when were the roof, HVAC, electrical panel, plumbing, and water heater last replaced?
- Is there a deadline driving the sale (1031 exchange, divorce, estate, relocation)? That informs how much negotiation room exists.
- Schools are B-rated — typically a magnet for longer-tenancy family renters. What's the average tenant stay here, and is there a school-zone premium baked into asking?
- What's the average days-on-market for RENTAL listings here right now (not sales)? A rising rental-DOM trend means longer vacancies and softer asking-rent achievability than the comps imply.
- What's the recent tenant-quality profile in this submarket — average credit score on applications, eviction rate, late-payment / NSF rate, and stable-employment percentage? A property-management company in the area should have these aggregated.
- How much new for-sale + rental construction is in the pipeline within 1–3 miles? Heavy new supply typically softens prices + rents 12–24 months out; constrained supply supports both.
Investment metrics
- 1% rule
- 1.12% ✓
- Cap rate
- 8.27%
- Cash-on-cash
- 7.06%
- DSCR
- 1.31
- GRM
- 7.4
CMA / ARV
- ARV (on-the-fly)
- $417,680
- Comps found
- 10
Show comp detail 10 sales within ~0.75 mi
| Address | Dist | Beds/Ba | Sqft | Sold | Price | $/sf | Match |
|---|---|---|---|---|---|---|---|
| 18 E 3rd St | 0.20mi | 3/2.0 | 1,008 (+10%) | 0mo | $502,000 | $498 | 74 |
| 10 E 3rd St | 0.21mi | 2/2.0 (-1) | 949 (+3%) | 14mo | $325 | — | 68 |
| 79 Frederick Ave | 0.19mi | 2/1.0 (-1) | 812 (-12%) | 6mo | $380,000 | $468 | 58 |
| 11 E 2nd St | 0.08mi | 2/2.0 (-1) | 1,008 (+10%) | 22mo | $456,000 | $452 | 57 |
| 132 W 2nd St | 0.25mi | 2/2.0 (-1) | 1,045 (+14%) | 5mo | $400,000 | $383 | 56 |
| 123 W 4th St | 0.35mi | 3/1.0 | 1,040 (+13%) | 4mo | $480,000 | $462 | 55 |
| 131 W 3rd St | 0.31mi | 2/2.0 (-1) | 1,020 (+11%) | 10mo | $463,000 | $454 | 54 |
| 44 E 3rd St | 0.25mi | 2/1.0 (-1) | 800 (-13%) | 5mo | $398,000 | $498 | 53 |
| 434 Georgia Tavern Rd | 0.62mi | 2/1.0 (-1) | 864 (-6%) | 10mo | $355,450 | $411 | 43 |
| 22 Smith St | 0.65mi | 3/1.0 | 1,036 (+13%) | 22mo | $421,000 | $406 | 26 |
Match score weights: distance 35% · size 25% · config 20% · recency 20%. Top-matched comps best support the ARV.
Projected returns pro-forma
-3.0% appreciation · 1.52% rent growth · sell at horizon
- IRR
- -7.2%
- Equity multiple
- 0.74×
- Total profit
- $-21,990
- Equity at exit
- $44,731
- IRR
- 0.4%
- Equity multiple
- 1.03×
- Total profit
- $2,114
- Equity at exit
- $25,939
Cash invested: $84,000 (down + closing). Projections, not guarantees.
Landlord ↔ Tenant lean methodology
- Overall (STATE)
- 21 Tenant-Leaning
- State New Jersey
- 21 Tenant-Leaning · D+6
- County
- — inherits STATE
- City
- — inherits STATE
ZIP-level market 07731
- Rents YoY
- 1.5%
- Active inventory
- 331
- Price-to-rent
- 7.4×
Monthly cashflow live
- Estimated rent
- $3,367 medium interval (Pro) →
- Mortgage (P&I)
- −$1,573
- Tax from tax record
- −$468 /mo · $5,615/yr
- Insurance
- −$125
- HOA
- −$0
- Vacancy / Maint / Mgmt
- −$707
- Net cashflow
- $494
Break-even live
UW: 25.0% down · 7.5% · 30yr · 1.5% tax · 5.0% vac · 8.0% maint · 8.0% mgmt
Financing live
Cash to close
- Down payment
- $75,000
- Closing costs
- $9,000
- Reserves months
- —
- Total cash needed
- —
Loan-product check · same deal, 3 products live
Conventional
25% down · 7.5% · 30yr
- Down + closing
- —
- Monthly P&I
- —
- Monthly cashflow
- —
- DSCR
- —
- Eligible?
- —
Personal DTI + credit; lowest rate.
DSCR
20% down · 8.5% · 30yr
- Down + closing
- —
- Monthly P&I
- —
- Monthly cashflow
- —
- DSCR
- —
- Eligible?
- —
No personal income docs; deal must DSCR.
Hard money
10% down · 12.0% · 12mo
- Down + closing
- —
- Monthly P&I
- —
- Monthly cashflow
- —
- DSCR
- —
- Eligible?
- —
Short-term bridge; refi at stabilization.
Rent comps 2 comps
| Address | Beds | Baths | Sqft | Rent | $/sqft | DOM | Units | Dist |
|---|---|---|---|---|---|---|---|---|
| 633 Hulses Corner Rd Howell, NJ | 3.0 | 1.0 | 1088 | $3,100 | $2.85 | 1d | 1 | 0.63mi |
| 15 N American Dr Howell Township, NJ | 3.0 | 1.0 | 753 | $2,899 | $3.85 | 1d | 7 | 1.16mi |
Listing history 13 events
-
2026-06-07statusdays on market $300,000 Pending 15 DOM
-
2026-06-04days on market $300,000 Active 14 DOM
-
2026-06-03days on market $300,000 Active 13 DOM
-
2026-06-02days on market $300,000 Active 12 DOM
-
2026-06-01days on market $300,000 Active 11 DOM
-
2026-05-31days on market $300,000 Active 10 DOM
-
2026-05-13price $599,999 191-char remark
Show marketing remark (191 chars)
2 BEDROOM, 2 BATH HOUSE W/ FINISHED BASEMENT, being sold as is . LARGE BACKYARD, CONVENIENT TO 195, ROUT 9, PARKS AND SHOPPING. ,SOLD IN AS IS CONDITION, CERT. OF OCC BUYER'S RESPONSIBILITY.
-
2026-05-12$650,000 Active 191-char remark
Show marketing remark (191 chars)
2 BEDROOM, 2 BATH HOUSE W/ FINISHED BASEMENT, being sold as is . LARGE BACKYARD, CONVENIENT TO 195, ROUT 9, PARKS AND SHOPPING. ,SOLD IN AS IS CONDITION, CERT. OF OCC BUYER'S RESPONSIBILITY.
-
2010-06-09soldstatus $151,900 206-char remark
Show marketing remark (206 chars)
LOVELY 2 BEDROOM, 2 BATH HOUSE W/FINISHED BASEMENT, MOVE-IN CONDITION. LARGE BACKYARD, CONVENIENT TO 195, ROUT 9, PARKS AND SHOPPING. BANK OWNED,SOLD IN AS IS CONDITION, CERT. OF OCC BUYER'S RESPONSIBILITY.
-
2010-02-16$156,200 206-char remark
Show marketing remark (206 chars)
LOVELY 2 BEDROOM, 2 BATH HOUSE W/FINISHED BASEMENT, MOVE-IN CONDITION. LARGE BACKYARD, CONVENIENT TO 195, ROUT 9, PARKS AND SHOPPING. BANK OWNED,SOLD IN AS IS CONDITION, CERT. OF OCC BUYER'S RESPONSIBILITY.
-
2005-08-16soldstatus $275,000
-
1992-05-29soldstatus $98,000
-
1982-06-04soldstatus $70,000
ⓘ Source: listings_history table (triggers on properties + properties_extension) + one-shot
backfill from property_details.listing_events for pre-trigger history.
Tax reassessment forecast NJ · Partial reset (capped growth)
- Current annual tax
- $5,615 · $468/mo
- Projected year-2 tax
- $6,542 · $545/mo
- Expected delta
- +$928/yr (+$77/mo · 16.5%)
ⓘ Screening estimate from a state-policy table — verify with the county assessor before closing.
Climate risk First Street
- Flood 1/10 Low FEMA zone X (unshaded) · 0% chance over 30 yrs
- Wildfire 2/10 Low
- Heat 6/10 Major 7 d/yr ≥100°F today · 15 d/yr by 30 yrs out
- Wind 6/10 Major 56% chance of damaging wind over 30 yrs
- Air quality 4/10 Moderate 4 unhealthy d/yr today · 5 by 30 yrs out
Nearby sold comps map
Loading sold comps map…
Walkable amenities ~0.75 mi
Loading nearby amenities…
Taxation est. · year 1
- Rental income
- $40,405
- − Mortgage interest
- −$16,805
- − Property taxes
- −$5,615
- − Insurance
- −$1,500
- − Repairs & maintenance
- −$3,232
- − Management
- −$3,232
- − Depreciation
- −$8,727
- Taxable income
- $1,294
- Est. tax owed @ 24.0%
- −$311
- After-tax cash flow
- $5,616/yr
For passive investors: Depreciation is non-cash, so a rental often shows a tax loss while cash-flowing — sheltering income. Rental losses are passive: they offset passive income freely, and up to $25,000/yr can offset ordinary (W-2) income if you actively participate and your MAGI is under $100k (phasing out to $0 by $150k); unused losses carry forward. On sale, claimed depreciation is recaptured at up to 25%, and gains may owe capital-gains tax (a 1031 exchange can defer both). Figures are a year-1 estimate at your 24.0% rate — not tax advice; consult a CPA.
Schools (NCES district)
- District
- Howell Township Public School District
- NCES district ID
- 3407560
- Math proficiency
- 30% ▼ -26.00%
- Reading proficiency
- 52% ▼ -16.00%
- Median HH income
- $93,085
- Composite
- 39.35/100
- National rank
- #3979
- State rank
- #195 of 472 in NJ
Livability — West Freehold
- Score
- 74/100
- State rank
- #173
- US rank
- #4542
Category grades
Schools grade is shown separately in the Schools card above.
Census & demographics
- County
- Monmouth County · 505,557 people
- City population
- 56,623
- Metro
- New York-Newark-Jersey City, NY-NJ-PA
- Population (ZIP)
- 40,322
- Household income
- $134,056
- Rent vs Own
- Severe rent burden
- 590.0
Population outlook (Monmouth County) Hauer SSP2
- Today (2025)
- 620,308 people
- By 2030
- 612,309 · -1.3%
- By 2040
- 587,297 · -5.3%
- By 2050
- 551,342 · -11.1%
- By 2075
- 472,934 · -23.8%
- By 2100
- 381,534 · -38.5%
Race, ethnicity, and origin ACS 2023
- Neighborhood character
- Predominantly White (73%)
- Race & ethnicity
- White 73% Hispanic / Latino 16% Two or more races 10% Black 4% Asian 3%
- Hispanic origin (detail)
- Mexican 3% Puerto Rican 5% Cuban 1% Dominican 2%
- Common ancestry
- Romanian 6% Scotch-Irish 2% Lithuanian 1%
- Foreign-born
- 13% · Canada, Jamaica, China
- Languages at home
- 83% English-only · Spanish 10% Other Indo-European 2% Russian/Polish/Slavic 2%
Political lean MEDSL · Monmouth
- 2024 margin
- R (+11.4) · D 43.4% · R 54.8% · Other 1.8%
- 2008→2024 swing
- -7.7pp toward R · 2008: -3.7pp · 2024: -11.4pp
- All cycles
- 2024: R+11.4 2020: R+2.8 2016: R+9.5 2012: R+5.5 2008: R+3.7
Not yet ingested
- Civics
- —
Market trends
- HPI YoY
- ▼ -303.76%
- Current HPI
- 375.492
- Rent YoY
- ▲ 1.52%
- Metro
- New York-Newark-Jersey City, NY-NJ-PA
- State GDP YoY
- ▲ 2.05%
- F500 in state
- 34
Industry mix (Fortune 500 HQ in NJ)
| Industry | F500 HQs | Revenue |
|---|---|---|
| Consumer Goods | 3 | $31B |
|
||
| Pharmaceuticals | 2 | $153B |
|
||
| Technology | 2 | $21B |
|
||
| Insurance | 2 | $20B |
|
||
| Healthcare | 2 | $19B |
|
||
| Financial Services | 1 | $70B |
|
||
Price history
+757.1% since first listed7 events — show timeline
- 2026-05-13 Price Changed $599,999 FSBO.com
- 2026-05-12 Listed $650,000 FSBO.com
- 2010-06-09 Sold (MLS) $151,900 MOMLS
- 2010-02-16 Listed $156,200 MOMLS
- 2005-08-16 Sold (Public Records) $275,000 Public Records
- 1992-05-29 Sold (Public Records) $98,000 Public Records
- 1982-06-04 Sold (Public Records) $70,000 Public Records
Property tax history
+2.0%/yrLatest (2025): $5,615 · +7.3% YoY. Source: county tax records.
Cash-flow waterfall
monthlySold comps — $/sqft
last 12 mo · ≤1 miLoading sold comps…