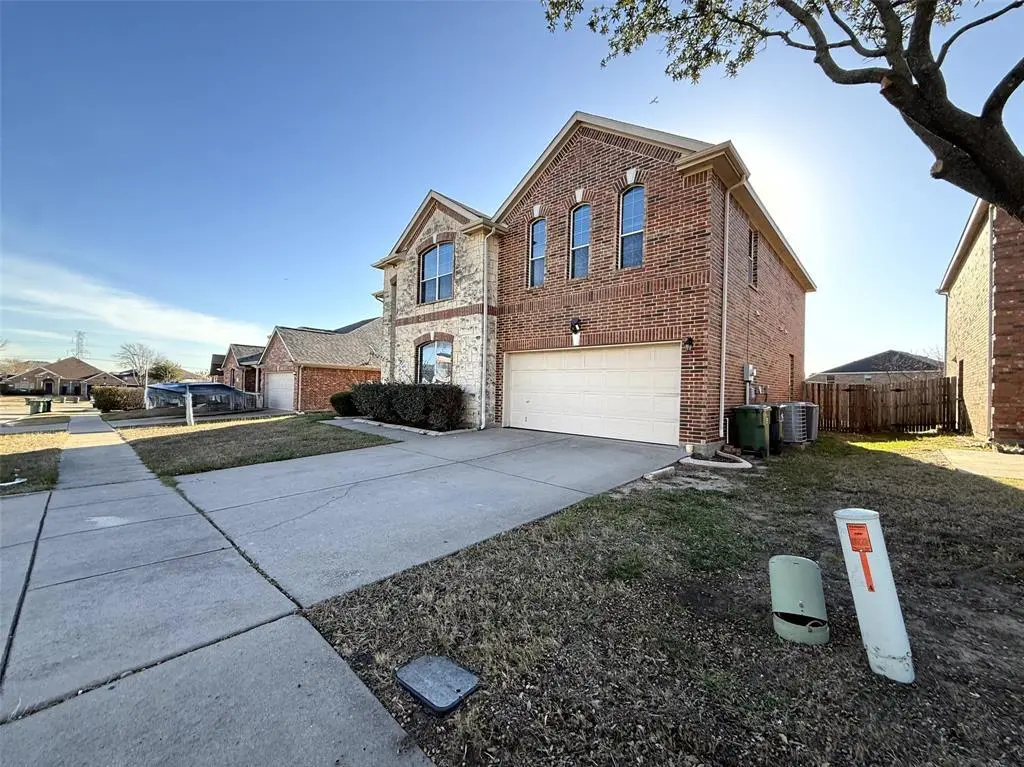
1306 Webb Ferrell Rd S
Arlington, TX 76002
$341,000D-
3 bd · 2.0 ba ·
3,297 sqft ·
Built 2005
· SingleFamily
· Pending
· 21 DOM
Cashflow @ list (25.0% down · 7.5%)
Estimated rent
$2,855/mo
Mortgage (P&I)
−$1,788
Tax + insurance
−$1,061
HOA
−$0
Vac / Maint / Mgmt
−$599
Net cashflow
$-594/mo
Annual
$-7,124/yr
Cap rate
4.20%
Cash-on-cash
-7.46%
DSCR
0.67
1% rule
0.84%
Cash to close
$95,480
Investor read
- This is a 3-bed/2.0-bath single-family listed at $341k.
- At list price, monthly cash flow is $-594 ($-7k/yr) — negative.
- To cash-flow at today's rent, offer at most $236k (30.8% below list).
- To meet the 1% rule (rent ≥ 1% of price), the offer needs to be $285k (16.3% below list).
- It's been on market 21 days — a 2% lower offer ($336k) is reasonable based on typical stale-listing flexibility.
- Recommended offer: $236k (30.8% below list) — sets the bar for cash-flow.
- Local home prices are declining (-3.0%/yr); year-one equity from $2k of loan paydown is wiped out by about $10k of value loss. Plan a longer hold.
- Location reads 78/100 on livability (#75 in TX, #2,697 nationally) — a middle-class / working-renter tenant base. Strengths: amenities A+, cost of living A+, housing A+; Watch: schools D+, crime F, commute F.
- Mansfield ISD (suburban): math 47% / reading 53% proficiency, ranked #125 of 826 in TX (top 15%) — acceptable for families but not a draw, mixed tenant base, ~2y average lease.
- Watch-outs: property tax is 3.2% of price.
- Market conditions: Rents rising (+3.1%/yr); 98 active listings in the ZIP; 15 comparable units currently listed for rent nearby; rentals lingering (median 44d on market — plan ~5-8 weeks vacancy on turnover, expect pricing pressure); 60% of comp listings sitting > 30 days — soft ceiling on asking rent; solid renter incomes; 18,938 units permitted in Tarrant County in 2024 (8,336 in 5+ unit buildings).
- Tarrant County population projected at +41% by 2050 — long-run rental-demand tailwind backs the buy-and-hold thesis.
- 3 sale attempts since 7y ago with the ask held roughly flat each time — persistent listings suggest the price (not the market) is what's stuck; bring a comps-based counter.
- Climate carrying-cost: major wind risk, 27% chance of damaging wind over 30y; extreme-heat days projected 7→24/yr by 2055 (HVAC capex compounding) — expect insurance premiums to compound above CPI over the hold.
- This rent runs 34% of the median local income ($101k/yr) — at the standard rent-burdened threshold; future hikes will face affordability resistance.
Questions for listing agent
- What do current leases actually rent for vs. the listed asking? Can we see a recent rent roll and the last 12 months of T-12 income?
- Property tax is high relative to price — has the assessment been appealed recently, and will the sale trigger a re-assessment?
- Is there a deadline driving the sale (1031 exchange, divorce, estate, relocation)? That informs how much negotiation room exists.
- Schools are D-rated, which usually means shorter tenancies and higher turnover. Who's the typical renter profile here, and what's been the actual vacancy rate?
- Crime grade is F in this area — have there been break-ins, vandalism, or insurance claims at this property in the last 3 years? What carrier currently insures it and at what premium?
- The area grade is low — what's the realistic commute time and amenity access for the typical tenant pool here? Any planned neighborhood developments (good or bad) we should know about?
- What's the average days-on-market for RENTAL listings here right now (not sales)? A rising rental-DOM trend means longer vacancies and softer asking-rent achievability than the comps imply.
- What's the recent tenant-quality profile in this submarket — average credit score on applications, eviction rate, late-payment / NSF rate, and stable-employment percentage? A property-management company in the area should have these aggregated.
CashFlowRE · CFR-RZP130CMRAX3YY
· Data 3 weeks ago
cashflowre.app · 2026-05-29