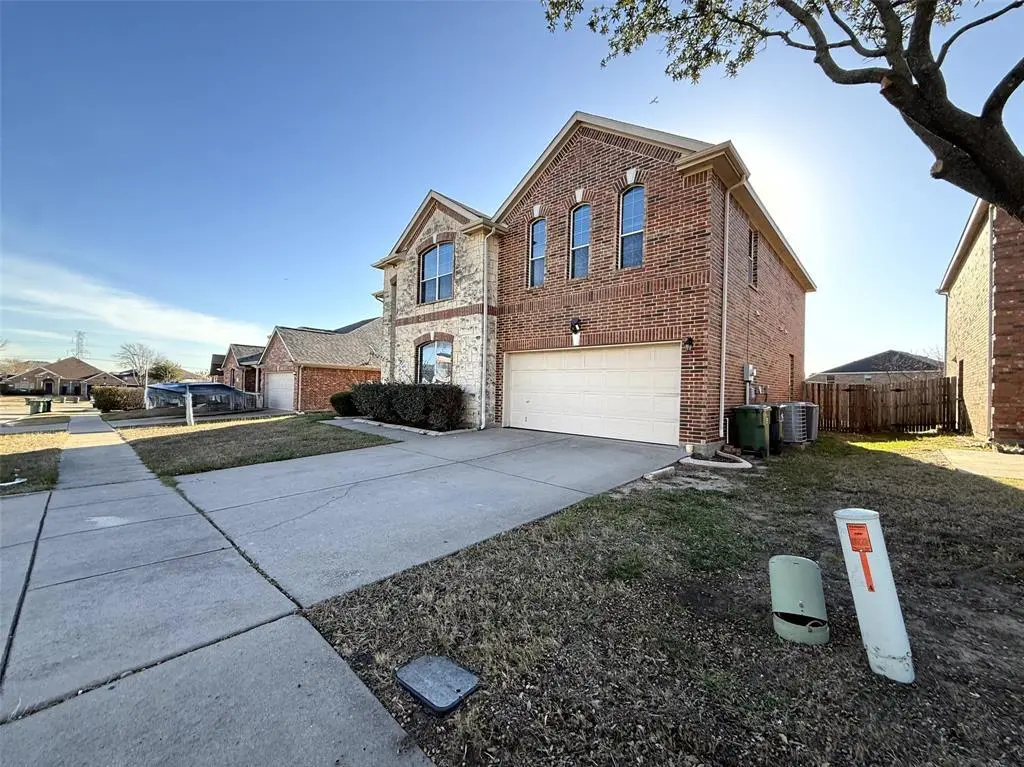
1306 Webb Ferrell Rd S · Arlington, TX
Flood risk 1/10 · Minimal
- FEMA flood zone
- X (unshaded)
- Chance of flooding over 30 yrs
- 0.0%
- Est. flood insurance / yr
- $507 – $1,088
Fire risk 4/10 · Minor
- Est. fire insurance / yr
- $1,222 – $2,270
Heat risk 7/10 · Major
- Hot days now (above 110°F)
- 7 days/yr
- Hot days in 30 yrs
- 24 days/yr
Wind risk 6/10 · Moderate
- Chance of severe wind over 30 yrs
- 27.0%
Air-quality risk 3/10 · Minor
- Unhealthy air days now
- 2 days/yr
- Unhealthy air days in 30 yrs
- 3 days/yr
Risk factors via First Street. Map © Google.
Why this score? — see what drove the D- grade
The composite is a weighted blend of 9 inputs, each scored 0–100. Each bar is that input's sub-score; the figure is the points it added to the 100-point composite (weight × sub-score).
- ARV discount +15.0/15.0
- Cash flow +6.4/30.0
- Schools +4.6/10.0
- Livability +3.9/5.0
- 1% rule +3.4/10.0
- Rent growth +3.3/5.0
- Condition / age +2.5/5.0
- DSCR +0.7/10.0
- Appreciation +0.0/10.0
$341,000
🖨 Deal sheet 📄 Offer letter ✓ Due diligence
Listing remarks MLS
Welcome to a home that instantly stands out—where space, comfort, and everyday convenience come together. This beautiful 4-bedroom, 2-bath home with a 2-car attached garage offers a bright and open layout, multiple living areas, and great natural light throughout. The kitchen flows seamlessly into the main spaces, making it perfect for both daily living and entertaining. The home is in fair condition and offers a solid opportunity to personalize or add value over time. Enjoy a spacious backyard ideal for relaxing or gatherings. Located near Webb Community Park, Tierra Verde Golf Club, Arlington Highlands, The Parks Mall, and with easy access to TX-360 and US-287 for shopping, dining, and commuting.
Key facts
- Spacious backyard
- Great natural light
- 7,318 sq ft lot
Tags
Neighborhood map
What this means for you Summary
Snapshot
- This is a 3-bed/2.0-bath single-family listed at $341k.
Deal economics
- At list price, monthly cash flow is $-594 ($-7k/yr) — negative.
- To cash-flow at today's rent, offer at most $236k (30.8% below list).
- To meet the 1% rule (rent ≥ 1% of price), the offer needs to be $285k (16.3% below list).
- Recommended offer: $236k (30.8% below list) — sets the bar for cash-flow.
Location & tenants
- Location reads 78/100 on livability (#75 in TX, #2,697 nationally) — a middle-class / working-renter tenant base. Strengths: amenities A+, cost of living A+, housing A+; Watch: schools D+, crime F, commute F.
- Mansfield ISD (suburban): math 47% / reading 53% proficiency, ranked #125 of 826 in TX (top 15%) — acceptable for families but not a draw, mixed tenant base, ~2y average lease.
- Market conditions: Rents rising (+3.1%/yr); 98 active listings in the ZIP; 15 comparable units currently listed for rent nearby; rentals lingering (median 44d on market — plan ~5-8 weeks vacancy on turnover, expect pricing pressure); 60% of comp listings sitting > 30 days — soft ceiling on asking rent; solid renter incomes; 18,938 units permitted in Tarrant County in 2024 (8,336 in 5+ unit buildings).
- This rent runs 34% of the median local income ($101k/yr) — at the standard rent-burdened threshold; future hikes will face affordability resistance.
Forward outlook
- Local home prices are declining (-3.0%/yr); year-one equity from $2k of loan paydown is wiped out by about $10k of value loss. Plan a longer hold.
- Tarrant County population projected at +41% by 2050 — long-run rental-demand tailwind backs the buy-and-hold thesis.
Negotiation context
- It's been on market 21 days — a 2% lower offer ($336k) is reasonable based on typical stale-listing flexibility.
- 3 sale attempts since 7y ago with the ask held roughly flat each time — persistent listings suggest the price (not the market) is what's stuck; bring a comps-based counter.
Risks & watch-outs
- Watch-outs: property tax is 3.2% of price.
- Climate carrying-cost: major wind risk, 27% chance of damaging wind over 30y; extreme-heat days projected 7→24/yr by 2055 (HVAC capex compounding) — expect insurance premiums to compound above CPI over the hold.
Questions for the listing agent
- What do current leases actually rent for vs. the listed asking? Can we see a recent rent roll and the last 12 months of T-12 income?
- Property tax is high relative to price — has the assessment been appealed recently, and will the sale trigger a re-assessment?
- Is there a deadline driving the sale (1031 exchange, divorce, estate, relocation)? That informs how much negotiation room exists.
- Schools are D-rated, which usually means shorter tenancies and higher turnover. Who's the typical renter profile here, and what's been the actual vacancy rate?
- Crime grade is F in this area — have there been break-ins, vandalism, or insurance claims at this property in the last 3 years? What carrier currently insures it and at what premium?
- The area grade is low — what's the realistic commute time and amenity access for the typical tenant pool here? Any planned neighborhood developments (good or bad) we should know about?
- What's the average days-on-market for RENTAL listings here right now (not sales)? A rising rental-DOM trend means longer vacancies and softer asking-rent achievability than the comps imply.
- What's the recent tenant-quality profile in this submarket — average credit score on applications, eviction rate, late-payment / NSF rate, and stable-employment percentage? A property-management company in the area should have these aggregated.
- How much new for-sale + rental construction is in the pipeline within 1–3 miles? Heavy new supply typically softens prices + rents 12–24 months out; constrained supply supports both.
Investment metrics
- 1% rule
- 0.84% ✗
- Cap rate
- 4.20%
- Cash-on-cash
- -7.46%
- DSCR
- 0.67
- GRM
- 10.0
CMA / ARV
- ARV (median comp)
- $417,531
- List price
- $341,000
- Delta
- -18.33%
- Verdict
- UNDERPRICED
- Comps
- 20 within 1.0 mi
Show comp detail 8 sales within ~0.75 mi
| Address | Dist | Beds/Ba | Sqft | Sold | Price | $/sf | Match |
|---|---|---|---|---|---|---|---|
| 1306 Webb Ferrell Rd S | 0.00mi | 4/2.0 (+1) | 3,297 (0%) | 1mo | $341,000 | $103 | 94 |
| 1500 Deer Crossing Dr | 0.29mi | 4/3.0 (+1) | 3,228 (-2%) | 6mo | $425,000 | $132 | 69 |
| 7608 White Fawn Rd | 0.43mi | 4/2.5 (+1) | 3,191 (-3%) | 12mo | $450,000 | $141 | 58 |
| 1303 Red Deer Way | 0.24mi | 4/2.5 (+1) | 2,862 (-13%) | 3mo | $410,000 | $143 | 57 |
| 7703 Fallen Antler Pl | 0.50mi | 4/2.5 (+1) | 3,459 (+5%) | 9mo | $415,000 | $120 | 54 |
| 8105 York Beach Pl | 0.43mi | 4/2.5 (+1) | 2,926 (-11%) | 3mo | $350,000 | $120 | 52 |
| 1614 White Willow Ln | 0.41mi | 4/3.5 (+1) | 3,149 (-4%) | 18mo | $424,900 | $135 | 47 |
| 7500 Sweetwater Ln | 0.45mi | 4/3.0 (+1) | 2,825 (-14%) | 22mo | $529,000 | $187 | 28 |
Match score weights: distance 35% · size 25% · config 20% · recency 20%. Top-matched comps best support the ARV.
Projected returns pro-forma
-3.0% appreciation · 3.1% rent growth · sell at horizon
- IRR
- -29.0%
- Equity multiple
- 0.03×
- Total profit
- $-92,435
- Equity at exit
- $50,844
- IRR
- -28.0%
- Equity multiple
- -0.33×
- Total profit
- $-126,593
- Equity at exit
- $29,483
Cash invested: $95,480 (down + closing). Projections, not guarantees.
Landlord ↔ Tenant lean methodology
- Overall (STATE)
- 87 Strongly Landlord-Friendly
- State Texas
- 87 Strongly Landlord-Friendly · R+5
- County
- — inherits STATE
- City
- — inherits STATE
ZIP-level market 76002
- Home prices YoY
- -4.6%
- Rents YoY
- 3.1%
- Active inventory
- 98
- Price-to-rent
- 10.0×
Monthly cashflow live
- Estimated rent
- $2,855 high interval (Pro) →
- Mortgage (P&I)
- −$1,788
- Tax from tax record
- −$919 /mo · $11,022/yr
- Insurance
- −$142
- HOA
- −$0
- Vacancy / Maint / Mgmt
- −$599
- Net cashflow
- $-594
Break-even live
UW: 25.0% down · 7.5% · 30yr · 1.5% tax · 5.0% vac · 8.0% maint · 8.0% mgmt
Financing live
Cash to close
- Down payment
- $85,250
- Closing costs
- $10,230
- Reserves months
- —
- Total cash needed
- —
Loan-product check · same deal, 3 products live
Conventional
25% down · 7.5% · 30yr
- Down + closing
- —
- Monthly P&I
- —
- Monthly cashflow
- —
- DSCR
- —
- Eligible?
- —
Personal DTI + credit; lowest rate.
DSCR
20% down · 8.5% · 30yr
- Down + closing
- —
- Monthly P&I
- —
- Monthly cashflow
- —
- DSCR
- —
- Eligible?
- —
No personal income docs; deal must DSCR.
Hard money
10% down · 12.0% · 12mo
- Down + closing
- —
- Monthly P&I
- —
- Monthly cashflow
- —
- DSCR
- —
- Eligible?
- —
Short-term bridge; refi at stabilization.
Rent comps 15 comps
| Address | Beds | Baths | Sqft | Rent | $/sqft | DOM | Units | Dist |
|---|---|---|---|---|---|---|---|---|
| 7911 Decoy Dr Arlington, TX | 4.0 | 2.0 | 2355 | $2,800 | $1.19 | 43d | 1 | 0.07mi |
| 7718 Water Fowl Trl Arlington, TX | 4.0 | 2.5 | 3087 | $3,040 | $0.98 | 20d | 1 | 0.21mi |
| 1509 Weeping Willow Ln Arlington, TX | 4.0 | 3.5 | 2431 | $2,750 | $1.13 | 24d | 1 | 0.32mi |
| 1509 Weeping Willow Ln Arlington, TX | 4.0 | 3.5 | 2431 | $2,750 | $1.13 | 7d | 1 | 0.32mi |
| 8115 Wesson Rd Arlington, TX | 3.0 | 2.0 | 2384 | $2,261 | $0.95 | 43d | 1 | 0.75mi |
| 8107 Young Ct Arlington, TX | 3.0 | 2.5 | 2661 | $2,500 | $0.94 | 43d | 1 | 0.80mi |
| 524 Zachum Dr Arlington, TX | 4.0 | 2.5 | 3142 | $2,850 | $0.91 | 43d | 1 | 0.90mi |
| 606 Primavera Dr Arlington, TX | 4.0 | 2.0 | 2419 | $3,100 | $1.28 | 12d | 1 | 1.02mi |
| 8402 Olivia Meadow Dr Arlington, TX | 4.0 | 2.5 | 2606 | $2,800 | $1.07 | 43d | 1 | 1.14mi |
| 6718 Meadowcrest Dr Arlington, TX | 4.0 | 2.0 | 2297 | $3,100 | $1.35 | 43d | 1 | 1.26mi |
| 7218 Fossil Rim Trl Arlington, TX | 4.0 | 2.5 | 2365 | $2,850 | $1.21 | 24d | 1 | 1.28mi |
| 7232 Jurassic Dr Arlington, TX | 4.0 | 2.5 | 2423 | $2,623 | $1.08 | 43d | 1 | 1.35mi |
| 503 Ammonite Ct Arlington, TX | 4.0 | 2.5 | 3350 | $3,075 | $0.92 | 43d | 1 | 1.37mi |
| 343 Mesquite Hill Dr Arlington, TX | 3.0 | 2.5 | 2539 | $3,095 | $1.22 | 17d | 1 | 1.46mi |
| 14 Enchanted Ct Mansfield, TX | 4.0 | 2.0 | 2293 | $2,600 | $1.13 | 43d | 1 | 1.48mi |
Listing history 11 events
-
2026-05-04status Pending 713-char remark
Show marketing remark (713 chars)
Welcome to a home that instantly stands out—where space, comfort, and everyday convenience come together. This beautiful 4-bedroom, 2-bath home with a 2-car attached garage offers a bright and open layout, multiple living areas, and great natural light throughout. The kitchen flows seamlessly into the main spaces, making it perfect for both daily living and entertaining. The home is in fair condition and offers a solid opportunity to personalize or add value over time. Enjoy a spacious backyard ideal for relaxing or gatherings. Located near Webb Community Park, Tierra Verde Golf Club, Arlington Highlands, The Parks Mall, and with easy access to TX-360 and US-287 for shopping, dining, and commuting.
-
2026-04-13$341,000 Active 713-char remark
Show marketing remark (713 chars)
Welcome to a home that instantly stands out—where space, comfort, and everyday convenience come together. This beautiful 4-bedroom, 2-bath home with a 2-car attached garage offers a bright and open layout, multiple living areas, and great natural light throughout. The kitchen flows seamlessly into the main spaces, making it perfect for both daily living and entertaining. The home is in fair condition and offers a solid opportunity to personalize or add value over time. Enjoy a spacious backyard ideal for relaxing or gatherings. Located near Webb Community Park, Tierra Verde Golf Club, Arlington Highlands, The Parks Mall, and with easy access to TX-360 and US-287 for shopping, dining, and commuting.
-
2025-04-04price $485,000
-
2025-04-04$385,000 Active
-
2024-05-02soldstatus
-
2019-12-31soldstatus
-
2019-12-27soldstatus Sold
-
2019-12-03status Pending
-
2019-11-22historical Active Option Contract
-
2019-11-08price $308,900
-
2019-10-04$311,900 Active
ⓘ Source: listings_history table (triggers on properties + properties_extension) + one-shot
backfill from property_details.listing_events for pre-trigger history.
Tax reassessment forecast TX · Resets to sale price
- Current annual tax
- $11,022 · $919/mo
- Projected year-2 tax
- $11,022 · $919/mo
- Expected delta
- $0/yr ($0/mo · 0.0%)
ⓘ Screening estimate from a state-policy table — verify with the county assessor before closing.
Climate risk First Street
- Flood 1/10 Low FEMA zone X (unshaded) · 0% chance over 30 yrs
- Wildfire 4/10 Moderate
- Heat 7/10 Severe 7 d/yr ≥110°F today · 24 d/yr by 30 yrs out
- Wind 6/10 Major 27% chance of damaging wind over 30 yrs
- Air quality 3/10 Moderate 2 unhealthy d/yr today · 3 by 30 yrs out
Nearby sold comps map
Loading sold comps map…
Walkable amenities ~0.75 mi
Loading nearby amenities…
Taxation est. · year 1
- Rental income
- $34,256
- − Mortgage interest
- −$19,101
- − Property taxes
- −$11,022
- − Insurance
- −$1,705
- − Repairs & maintenance
- −$2,740
- − Management
- −$2,740
- − Depreciation
- −$9,920
- Taxable loss
- −$12,974
- Est. tax savings @ 24.0%
- +$3,114
- After-tax cash flow
- $-4,010/yr
For passive investors: Depreciation is non-cash, so a rental often shows a tax loss while cash-flowing — sheltering income. Rental losses are passive: they offset passive income freely, and up to $25,000/yr can offset ordinary (W-2) income if you actively participate and your MAGI is under $100k (phasing out to $0 by $150k); unused losses carry forward. On sale, claimed depreciation is recaptured at up to 25%, and gains may owe capital-gains tax (a 1031 exchange can defer both). Figures are a year-1 estimate at your 24.0% rate — not tax advice; consult a CPA.
Schools (NCES district)
- District
- Mansfield ISD
- NCES district ID
- 4828920
- Math proficiency
- 47% ▼ -17.00%
- Reading proficiency
- 53% ▼ -6.00%
- Median HH income
- $81,934
- Composite
- 45.82/100
- National rank
- #2558
- State rank
- #125 of 826 in TX
Livability — Arlington
- Score
- 78/100
- State rank
- #75
- US rank
- #2697
Category grades
Schools grade is shown separately in the Schools card above.
Census & demographics
- Census place
- Arlington, TX
- County
- Tarrant County · 2,033,669 people
- City population
- 366,588
- Metro
- Dallas-Fort Worth-Arlington, TX
- Population (ZIP)
- 35,265
- Household income
- $100,667
- Rent vs Own
- Severe rent burden
- 566.0
Population outlook (Tarrant County) Hauer SSP2
- Today (2025)
- 2,380,417 people
- By 2030
- 2,578,900 · +8.3%
- By 2040
- 2,974,995 · +25.0%
- By 2050
- 3,350,489 · +40.8%
- By 2075
- 4,216,909 · +77.2%
- By 2100
- 4,741,527 · +99.2%
Race, ethnicity, and origin ACS 2023
- Neighborhood character
- Highly diverse neighborhood (Simpson 0.74)
- Race & ethnicity
- Black 35% White 26% Hispanic / Latino 24% Asian 11% Two or more races 11%
- Hispanic origin (detail)
- Mexican 16% Puerto Rican 3%
- Common ancestry
- Swedish 1% Slovak 1% Arab 1%
- Foreign-born
- 25% · Canada, Vietnam, China
- Languages at home
- 62% English-only · Spanish 15% Vietnamese 7% Arabic 5%
Political lean MEDSL · Tarrant
- 2024 margin
- Lean R (+5.1) · D 46.7% · R 51.9% · Other 1.4%
- 2008→2024 swing
- +6.6pp toward D · 2008: -11.7pp · 2024: -5.1pp
- All cycles
- 2024: R+5.1 2020: D+0.2 2016: R+8.7 2012: R+15.7 2008: R+11.7
Not yet ingested
- Civics
- —
Market trends
- HPI YoY
- ▼ -12.36%
- Current HPI
- 256.7208
- Rent YoY
- ▲ 3.10%
- Metro
- Dallas-Fort Worth-Arlington, TX
- State GDP YoY
- ▲ 3.95%
- F500 in state
- 110
Industry mix (Fortune 500 HQ in TX)
| Industry | F500 HQs | Revenue |
|---|---|---|
| Energy | 16 | $1,198B |
|
||
| Technology | 5 | $198B |
|
||
| Engineering / Construction | 4 | $72B |
|
||
| Energy Services | 3 | $60B |
|
||
| Utilities | 3 | $41B |
|
||
| Healthcare | 2 | $330B |
|
||
Price history
+9.3% since first listed11 events — show timeline
- 2026-05-04 Pending — NTREIS
- 2026-04-13 Listed $341,000 NTREIS
- 2025-04-04 Price Changed $485,000 NTREIS
- 2025-04-04 Listed $385,000 NTREIS
- 2024-05-02 Sold (Public Records) — Public Records
- 2019-12-31 Sold (Public Records) — Public Records
- 2019-12-27 Sold (MLS) — NTREIS
- 2019-12-03 Pending — NTREIS
- 2019-11-22 Contingent — NTREIS
- 2019-11-08 Price Changed $308,900 NTREIS
- 2019-10-04 Listed $311,900 NTREIS
Property tax history
+6.1%/yrLatest (2025): $11,022 · +14.0% YoY. Source: county tax records.
Cash-flow waterfall
monthlySold comps — $/sqft
last 12 mo · ≤1 miLoading sold comps…