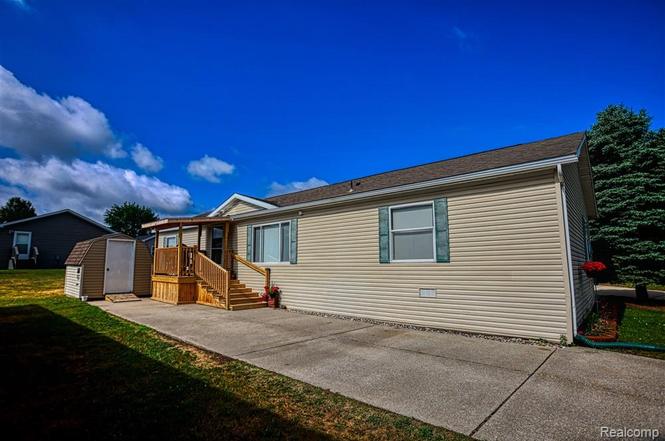
2670 Biscayne Ct
Lapeer, MI 48446
$105,000C
4 bd · 2.0 ba ·
1,500 sqft ·
Built 2000
· Other
· Active
· 7 DOM
Cashflow @ list (25.0% down · 7.5%)
Estimated rent
$1,768/mo
Mortgage (P&I)
−$551
Tax + insurance
−$175
HOA
−$525
Vac / Maint / Mgmt
−$371
Net cashflow
$146/mo
Annual
$1,757/yr
Cap rate
7.97%
Cash-on-cash
5.98%
DSCR
1.27
1% rule
1.68%
Cash to close
$29,400
Investor read
- This is a 4-bed/2.0-bath other listed at $105k.
- At list price, monthly cash flow is $146 ($2k/yr) — positive.
- The deal already cash-flows at list — no discount required.
- Meets the 1% rule at list price ($2k rent vs $105k).
- Only 7 days on market — expect competitive offers; lowballing is unlikely to land.
- Local home prices are declining (-3.0%/yr); year-one equity from $726 of loan paydown is wiped out by about $3k of value loss. Plan a longer hold.
- Location reads 72/100 on livability (#231 in MI) — a middle-class / working-renter tenant base. Strengths: cost of living A+, housing A+, health & safety A-; Watch: schools D+, employment D, commute F.
- Lapeer Community Schools (town): math 31% / reading 49% proficiency, ranked #202 of 540 in MI (top 37%) — families likely to look elsewhere, expect single-tenant / working-renter base with shorter leases.
- Watch-outs: HOA is 30% of rent.
- Market conditions: 186 active listings in the ZIP; 152 units permitted in Lapeer County in 2024 (0 in 5+ unit buildings).
- Lapeer County population projected at -10% by 2050 — secular population decline; favor cash flow + early exit over multi-decade hold.
- 2 sale attempts with the ask held roughly flat each time — persistent listings suggest the price (not the market) is what's stuck; bring a comps-based counter.
- Cap rate 8.0% vs local median 3.6% in Lapeer — top-decile yield for the area; either an underpriced asset or a hidden risk that comps aren't pricing in. Stress-test before assuming the spread holds.
- This rent runs 32% of the median local income ($66k/yr) — at the standard rent-burdened threshold; future hikes will face affordability resistance.
Questions for listing agent
- What does the HOA fee cover, when was the last increase, and are there any pending special assessments or reserve-fund shortfalls?
- Is there a deadline driving the sale (1031 exchange, divorce, estate, relocation)? That informs how much negotiation room exists.
- Schools are D-rated, which usually means shorter tenancies and higher turnover. Who's the typical renter profile here, and what's been the actual vacancy rate?
- What's the average days-on-market for RENTAL listings here right now (not sales)? A rising rental-DOM trend means longer vacancies and softer asking-rent achievability than the comps imply.
- What's the recent tenant-quality profile in this submarket — average credit score on applications, eviction rate, late-payment / NSF rate, and stable-employment percentage? A property-management company in the area should have these aggregated.
- How much new for-sale + rental construction is in the pipeline within 1–3 miles? Heavy new supply typically softens prices + rents 12–24 months out; constrained supply supports both.
CashFlowRE · CFR-S0XPWA5DFX0G7F
· Data 2 days ago
cashflowre.app · 2026-05-29