2670 Biscayne Ct · Lapeer, MI
Flood risk No data
- FEMA flood zone
- —
- Chance of flooding over 30 yrs
- —
- Est. flood insurance / yr
- —
Fire risk No data
- Est. fire insurance / yr
- —
Heat risk No data
- Hot days now (above threshold)
- —
- Hot days in 30 yrs
- —
Wind risk No data
- Chance of severe wind over 30 yrs
- —
Air-quality risk No data
- Unhealthy air days now
- —
- Unhealthy air days in 30 yrs
- —
Risk factors via First Street. Map © Google.
Why this score? — see what drove the C grade
The composite is a weighted blend of 9 inputs, each scored 0–100. Each bar is that input's sub-score; the figure is the points it added to the 100-point composite (weight × sub-score).
- Cash flow +20.9/30.0
- 1% rule +10.0/10.0
- ARV discount +7.5/15.0
- DSCR +6.7/10.0
- Livability +3.6/5.0
- Schools +3.5/10.0
- Rent growth +2.5/5.0
- Condition / age +2.5/5.0
- Appreciation +0.0/10.0
$105,000
🖨 Deal sheet 📄 Offer letter ✓ Due diligence
Listing remarks MLS
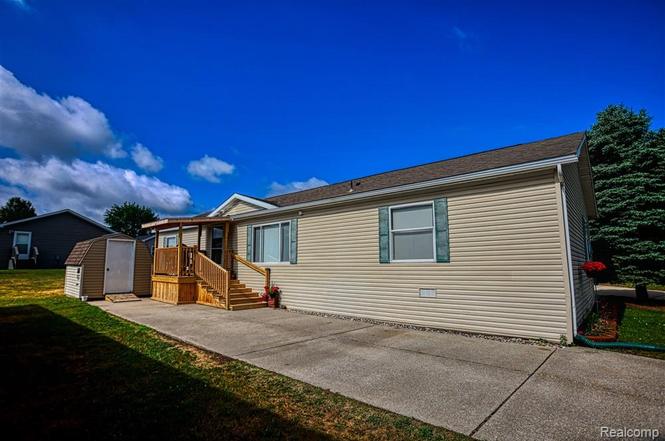
IT'S HERE!!! A 4 bedroom/2 full bathroom home in a beautifully maintained community!! This home needs nothing but a family to move in! The spacious bedrooms have ample closet space with 3 of the rooms having walk-in closets. The open kitchen/dining/living room keeps family together during meal times and when relaxing. The easy access stairs and covered porch were added just last fall and provide a safe entrance to the home. The Pine Lakes Community features a sparkling pool that is perfect for cooling off on sunny days, a fitness center that allows you to stay active without the commute or gym fees and a beautifully maintained clubhouse that provides a welcoming space for social gatherings and community events. This community is close to Lapeer but allows for a quiet living setting. Community approval is required prior to purchasing this home. Financing may be available, please call for more information!
Key facts
- Covered porch
- Fitness center
- Walk-in closets
Tags
Property features AI
Finance
- HOA & community: Homeowners association with monthly fee of $540; Community amenities: pool, clubhouse, fitness center; Property located in Pine Lakes community
Exterior
- Parking: Driveway (no garage)
- Utilities: Public water; Public sewer
- Home design: Single family residence; One story; Ground-level entry with steps; Vinyl siding; Asphalt roof
- Construction: Vinyl siding construction
- Exterior features: Covered porch; In-ground outdoor community pool; Shed(s); Paved road access; Irregular lot shape
Interior
- Kitchen: Free-standing gas range; Free-standing refrigerator; Dishwasher
- Bathrooms: 2 full bathrooms
- Heating & cooling: Forced air heating (natural gas); Central air; Ceiling fans
- Interior features: Electric water heater; Crawl space basement; Covered porch
- Laundry & utility: Laundry room; Washer; Dryer
Neighborhood map
What this means for you Summary
Snapshot
- This is a 4-bed/2.0-bath other listed at $105k.
Deal economics
- At list price, monthly cash flow is $146 ($2k/yr) — positive.
- The deal already cash-flows at list — no discount required.
- Meets the 1% rule at list price ($2k rent vs $105k).
- Cap rate 8.0% vs local median 3.6% in Lapeer — top-decile yield for the area; either an underpriced asset or a hidden risk that comps aren't pricing in. Stress-test before assuming the spread holds.
Location & tenants
- Location reads 72/100 on livability (#231 in MI) — a middle-class / working-renter tenant base. Strengths: cost of living A+, housing A+, health & safety A-; Watch: schools D+, employment D, commute F.
- Lapeer Community Schools (town): math 31% / reading 49% proficiency, ranked #202 of 540 in MI (top 37%) — families likely to look elsewhere, expect single-tenant / working-renter base with shorter leases.
- Market conditions: 186 active listings in the ZIP; 152 units permitted in Lapeer County in 2024 (0 in 5+ unit buildings).
- This rent runs 32% of the median local income ($66k/yr) — at the standard rent-burdened threshold; future hikes will face affordability resistance.
Forward outlook
- Local home prices are declining (-3.0%/yr); year-one equity from $726 of loan paydown is wiped out by about $3k of value loss. Plan a longer hold.
- Lapeer County population projected at -10% by 2050 — secular population decline; favor cash flow + early exit over multi-decade hold.
Negotiation context
- Only 7 days on market — expect competitive offers; lowballing is unlikely to land.
- 2 sale attempts with the ask held roughly flat each time — persistent listings suggest the price (not the market) is what's stuck; bring a comps-based counter.
Risks & watch-outs
- Watch-outs: HOA is 30% of rent.
Questions for the listing agent
- What does the HOA fee cover, when was the last increase, and are there any pending special assessments or reserve-fund shortfalls?
- Is there a deadline driving the sale (1031 exchange, divorce, estate, relocation)? That informs how much negotiation room exists.
- Schools are D-rated, which usually means shorter tenancies and higher turnover. Who's the typical renter profile here, and what's been the actual vacancy rate?
- What's the average days-on-market for RENTAL listings here right now (not sales)? A rising rental-DOM trend means longer vacancies and softer asking-rent achievability than the comps imply.
- What's the recent tenant-quality profile in this submarket — average credit score on applications, eviction rate, late-payment / NSF rate, and stable-employment percentage? A property-management company in the area should have these aggregated.
- How much new for-sale + rental construction is in the pipeline within 1–3 miles? Heavy new supply typically softens prices + rents 12–24 months out; constrained supply supports both.
Investment metrics
- 1% rule
- 1.68% ✓
- Cap rate
- 7.97%
- Cash-on-cash
- 5.98%
- DSCR
- 1.27
- GRM
- 4.9
CMA / ARV
No comps found within radius.
Projected returns pro-forma
-3.0% appreciation · 3.0% rent growth · sell at horizon
- IRR
- -6.7%
- Equity multiple
- 0.75×
- Total profit
- $-7,338
- Equity at exit
- $15,656
- IRR
- 3.3%
- Equity multiple
- 1.24×
- Total profit
- $7,039
- Equity at exit
- $9,078
Cash invested: $29,400 (down + closing). Projections, not guarantees.
Landlord ↔ Tenant lean methodology
- Overall (STATE)
- 62 Landlord-Friendly
- State Michigan
- 62 Landlord-Friendly · EVEN
- County
- — inherits STATE
- City
- — inherits STATE
ZIP-level market 48446
- Active inventory
- 186
- Price-to-rent
- 4.9×
Monthly cashflow live
- Estimated rent
- $1,768 medium interval (Pro) →
- Mortgage (P&I)
- −$551
- Tax est. 1.5%
- −$131 /mo · $1,575/yr
- Insurance
- −$44
- HOA
- −$525
- Vacancy / Maint / Mgmt
- −$371
- Net cashflow
- $146
Break-even live
UW: 25.0% down · 7.5% · 30yr · 1.5% tax · 5.0% vac · 8.0% maint · 8.0% mgmt
Financing live
Cash to close
- Down payment
- $26,250
- Closing costs
- $3,150
- Reserves months
- —
- Total cash needed
- —
Loan-product check · same deal, 3 products live
Conventional
25% down · 7.5% · 30yr
- Down + closing
- —
- Monthly P&I
- —
- Monthly cashflow
- —
- DSCR
- —
- Eligible?
- —
Personal DTI + credit; lowest rate.
DSCR
20% down · 8.5% · 30yr
- Down + closing
- —
- Monthly P&I
- —
- Monthly cashflow
- —
- DSCR
- —
- Eligible?
- —
No personal income docs; deal must DSCR.
Hard money
10% down · 12.0% · 12mo
- Down + closing
- —
- Monthly P&I
- —
- Monthly cashflow
- —
- DSCR
- —
- Eligible?
- —
Short-term bridge; refi at stabilization.
HOA detail
- Monthly dues
- $525 · $6,300/yr
- Likely covers
- poolgym
Listing history 6 events
-
2026-06-18days on market $105,000 Active 7 DOM
-
2026-06-17days on market $105,000 Active 6 DOM
-
2026-06-16days on market $105,000 Active 5 DOM
-
2026-06-15days on market $105,000 Active 4 DOM
-
2026-06-13remarks 699-char remark
-
2026-06-13$105,000 Active 2 DOM
ⓘ Source: listings_history table (triggers on properties + properties_extension) + one-shot
backfill from property_details.listing_events for pre-trigger history.
Nearby sold comps map
Loading sold comps map…
Walkable amenities ~0.75 mi
Loading nearby amenities…
Taxation est. · year 1
- Rental income
- $21,221
- − Mortgage interest
- −$5,882
- − Property taxes
- −$1,575
- − Insurance
- −$525
- − Repairs & maintenance
- −$1,698
- − Management
- −$1,698
- − HOA
- −$6,300
- − Depreciation
- −$3,055
- Taxable income
- $490
- Est. tax owed @ 24.0%
- −$118
- After-tax cash flow
- $1,640/yr
For passive investors: Depreciation is non-cash, so a rental often shows a tax loss while cash-flowing — sheltering income. Rental losses are passive: they offset passive income freely, and up to $25,000/yr can offset ordinary (W-2) income if you actively participate and your MAGI is under $100k (phasing out to $0 by $150k); unused losses carry forward. On sale, claimed depreciation is recaptured at up to 25%, and gains may owe capital-gains tax (a 1031 exchange can defer both). Figures are a year-1 estimate at your 24.0% rate — not tax advice; consult a CPA.
Schools (NCES district)
- District
- Lapeer Community Schools
- NCES district ID
- 2621180
- Math proficiency
- 31% ▼ -9.00%
- Reading proficiency
- 49% ▼ -4.00%
- Median HH income
- $53,749
- Composite
- 34.79/100
- National rank
- #5113
- State rank
- #202 of 540 in MI
Livability — Lapeer
- Score
- 72/100
- State rank
- #231
- US rank
- #5855
Category grades
Schools grade is shown separately in the Schools card above.
Census & demographics
- County
- Lapeer County · 30,581 people
- City population
- 30,581
- Metro
- Detroit-Warren-Dearborn, MI
- Population (ZIP)
- 30,581
- Household income
- $66,062
- Rent vs Own
- Severe rent burden
- 908.0
Population outlook (Lapeer County) Hauer SSP2
- Today (2025)
- 89,826 people
- By 2030
- 89,535 · -0.3%
- By 2040
- 86,695 · -3.5%
- By 2050
- 80,566 · -10.3%
- By 2075
- 65,783 · -26.8%
- By 2100
- 46,584 · -48.1%
Race, ethnicity, and origin ACS 2023
- Neighborhood character
- Predominantly White (89%)
- Race & ethnicity
- White 89% Two or more races 6% Hispanic / Latino 3% Black 3%
- Common ancestry
- Romanian 6% Lithuanian 4% Slovak 3%
- Foreign-born
- 1% · Canada
- Languages at home
- 98% English-only · Spanish 1%
Political lean MEDSL · Lapeer
- 2024 margin
- Solid R (+39.8) · D 29.5% · R 69.3% · Other 1.3%
- 2008→2024 swing
- -36.8pp toward R · 2008: -3.0pp · 2024: -39.8pp
- All cycles
- 2024: R+39.8 2020: R+36.3 2016: R+38.3 2012: R+11.5 2008: R+3.0
Not yet ingested
- Civics
- —
Market trends
- HPI YoY
- ▼ -243.58%
- Current HPI
- 212.3665
- Rent YoY
- —
- Metro
- Detroit-Warren-Dearborn, MI
- State GDP YoY
- ▲ 1.37%
- F500 in state
- 28
Industry mix (Fortune 500 HQ in MI)
| Industry | F500 HQs | Revenue |
|---|---|---|
| Automotive Parts | 3 | $48B |
|
||
| Automotive | 2 | $372B |
|
||
| Chemicals | 1 | $45B |
|
||
| Automotive Retail | 1 | $29B |
|
||
| Healthcare / Medical Devices | 1 | $23B |
|
||
| Automotive Technology | 1 | $20B |
|
||
Price history
+0.0% since first listed2 events — show timeline
- 2026-06-10 Listed $105,000 MiRealSource-MiMLS
- 2026-06-10 Listed $105,000 REALCOMP
Property tax history
+40.5%/yrLatest (2025): $126 · -1.2% YoY. Source: county tax records.
Cash-flow waterfall
monthlySold comps — $/sqft
last 12 mo · ≤1 miLoading sold comps…