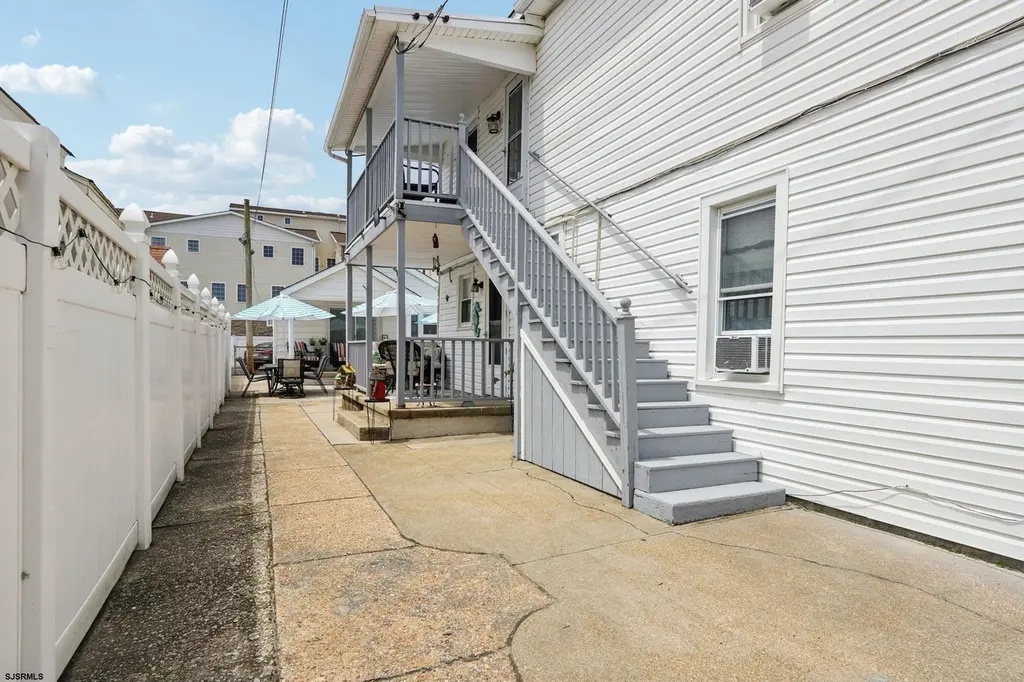
148 E Burk Ave #4
Wildwood, NJ 08260
$267,999B-
2 bd · 1.0 ba ·
— sqft ·
Built 1930
· Townhouse
· Active
· 17 DOM
Cashflow @ list (25.0% down · 7.5%)
Estimated rent
$5,451/mo
Mortgage (P&I)
−$1,405
Tax + insurance
−$873
HOA
−$0
Vac / Maint / Mgmt
−$1,145
Net cashflow
$2,028/mo
Annual
$24,334/yr
Cap rate
17.28%
Cash-on-cash
39.25%
DSCR
2.75
1% rule
2.03%
Cash to close
$75,040
Investor read
- This is a 2-bed/1.0-bath townhouse listed at $268k. Condition is rated good.
- At list price, monthly cash flow is $2k ($24k/yr) — positive.
- The deal already cash-flows at list — no discount required.
- Meets the 1% rule at list price ($5k rent vs $268k).
- It's been on market 17 days — a 2% lower offer ($264k) is reasonable based on typical stale-listing flexibility.
- Recommended offer: $264k (1.5% below list) — sets the bar for market timing.
- Local home prices are declining (-3.0%/yr); year-one equity from $2k of loan paydown is wiped out by about $8k of value loss. Plan a longer hold.
- Location reads 74/100 on livability (#176 in NJ, #4,679 nationally) — a middle-class / working-renter tenant base. Strengths: amenities A+, commute A+, health & safety A+; Watch: employment D, crime F, cost of living F.
- Wildwood City School District (suburban): math 12% / reading 27% proficiency, ranked #442 of 472 in NJ (top 94%) — low school quality limits family demand, transient renter base, plan for 1-2y turnover; 80% free/reduced lunch — lower-income household profile, screen leases tightly.
- Zoned schools: Glenwood Avenue Elementary School (math 8% / reading 27%, grade F, #1,065 of 1,303 statewide, top 83%, 396 students, 89% FRL); Wildwood Middle School (math 12% / reading 22%, grade F, #409 of 431 statewide, top 95%, 172 students, 87% FRL); Wildwood High School (math 22% / reading 47%, grade F, #239 of 399 statewide, top 61%, 263 students, 69% FRL) — zoned schools at 82% FRL track the district average.
- Watch-outs: flood insurance adds $427/mo; built in 1930 — expect roof / HVAC / electrical / plumbing capex.
- Market conditions: 436 active listings in the ZIP; 5 comparable units currently listed for rent nearby; rentals lingering (median 46d on market — plan ~5-8 weeks vacancy on turnover, expect pricing pressure); 100% of comp listings sitting > 30 days — soft ceiling on asking rent; 877 units permitted in Cape May County in 2024 (35 in 5+ unit buildings).
- Cape May County population projected at -24% by 2050 — secular population decline; favor cash flow + early exit over multi-decade hold.
- 7 sale attempts since 2y ago with the ask held roughly flat each time — persistent listings suggest the price (not the market) is what's stuck; bring a comps-based counter.
- At projected returns (-3.0% appreciation + 3.0% rent growth), your $75k cash investment doubles in ~4 years — after that, you're playing with house money.
- Climate carrying-cost: in FEMA flood zone AE (mandatory federal flood insurance); severe wind risk, 80% chance of damaging wind over 30y; extreme-heat days projected 7→19/yr by 2055 (HVAC capex compounding) — expect insurance premiums to compound above CPI over the hold.
- Cap rate 17.3% vs local median 5.6% in Wildwood — top-decile yield for the area; either an underpriced asset or a hidden risk that comps aren't pricing in. Stress-test before assuming the spread holds.
Questions for listing agent
- Built in 1930 — when were the roof, HVAC, electrical panel, plumbing, and water heater last replaced?
- What's the actual annual flood-insurance premium (NFIP or private), and is the property in a SFHA with mandatory coverage?
- Is there a deadline driving the sale (1031 exchange, divorce, estate, relocation)? That informs how much negotiation room exists.
- Schools are F-rated, which usually means shorter tenancies and higher turnover. Who's the typical renter profile here, and what's been the actual vacancy rate?
- Crime grade is F in this area — have there been break-ins, vandalism, or insurance claims at this property in the last 3 years? What carrier currently insures it and at what premium?
- What's the average days-on-market for RENTAL listings here right now (not sales)? A rising rental-DOM trend means longer vacancies and softer asking-rent achievability than the comps imply.
- What's the recent tenant-quality profile in this submarket — average credit score on applications, eviction rate, late-payment / NSF rate, and stable-employment percentage? A property-management company in the area should have these aggregated.
- How much new for-sale + rental construction is in the pipeline within 1–3 miles? Heavy new supply typically softens prices + rents 12–24 months out; constrained supply supports both.
CashFlowRE · CFR-S192GM096BDW2N
· Data 11 h ago
cashflowre.app · 2026-05-29