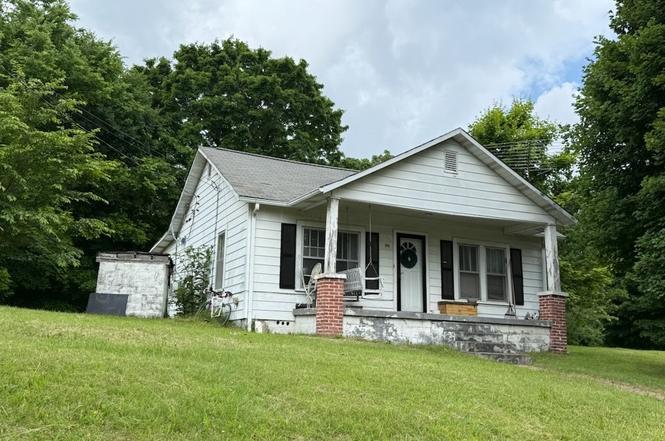
1910 River Rd
Clarksville, TN 37040
$90,000B-
2 bd · 1.0 ba ·
1,064 sqft ·
Built 1930
· SingleFamily
· Pending
· 288 DOM
Cashflow @ list (25.0% down · 7.5%)
Estimated rent
$1,408/mo
Mortgage (P&I)
−$472
Tax + insurance
−$150
HOA
−$0
Vac / Maint / Mgmt
−$296
Net cashflow
$490/mo
Annual
$5,881/yr
Cap rate
12.83%
Cash-on-cash
23.34%
DSCR
2.04
1% rule
1.56%
Cash to close
$25,200
Investor read
- This is a 2-bed/1.0-bath single-family listed at $90k.
- At list price, monthly cash flow is $490 ($6k/yr) — positive.
- The deal already cash-flows at list — no discount required.
- Meets the 1% rule at list price ($1k rent vs $90k).
- It's been on market 288 days — a 12% lower offer ($79k) is reasonable based on typical stale-listing flexibility.
- Recommended offer: $79k (12.0% below list) — sets the bar for market timing.
- Local home prices are declining (-3.0%/yr); year-one equity from $622 of loan paydown is wiped out by about $3k of value loss. Plan a longer hold.
- Location reads 84/100 on livability (#1 in TN, #798 nationally) — a professional / high-income tenant draw. Strengths: amenities A+, commute A+, cost of living A+; Watch: employment C-, crime D+.
- Montgomery County (urban): math 25% / reading 31% proficiency, ranked #65 of 139 in TN (top 47%) — low school quality limits family demand, transient renter base, plan for 1-2y turnover.
- Zoned schools: Cumberland Heights Elementary (math 45% / reading 34%, grade F, #231 of 952 statewide, top 26%, 592 students, 0% FRL); Montgomery Central High (math 6% / reading 40%, grade F, #149 of 332 statewide, top 46%, 1,056 students, 0% FRL) — zoned schools average 0% FRL vs 40% district-wide (40 pts lower); this property's tenant base skews higher-income than the district average.
- Watch-outs: built in 1930 — expect roof / HVAC / electrical / plumbing capex.
- Market conditions: Rents rising (+1.3%/yr); 604 active listings in the ZIP; 2 comparable units currently listed for rent nearby; 2,583 units permitted in Montgomery County in 2024 (617 in 5+ unit buildings).
- Montgomery County population projected at +49% by 2050 — long-run rental-demand tailwind backs the buy-and-hold thesis.
- At projected returns (-3.0% appreciation + 1.3% rent growth), your $25k cash investment doubles in ~6 years — after that, you're playing with house money.
- Climate carrying-cost: extreme-heat days projected 7→20/yr by 2055 (HVAC capex compounding) — expect insurance premiums to compound above CPI over the hold.
- Cap rate 12.8% vs local median 3.5% in Clarksville — top-decile yield for the area; either an underpriced asset or a hidden risk that comps aren't pricing in. Stress-test before assuming the spread holds.
Questions for listing agent
- It's been on market 288 days. Have you received any prior offers? Is the seller open to a 12% concession, seller financing, or rate buy-down credit?
- Built in 1930 — when were the roof, HVAC, electrical panel, plumbing, and water heater last replaced?
- Why hasn't it sold? Are there any deal-killer items the seller is aware of (foundation, flood, title, zoning, code violations)?
- Is there a deadline driving the sale (1031 exchange, divorce, estate, relocation)? That informs how much negotiation room exists.
- Crime grade is D in this area — have there been break-ins, vandalism, or insurance claims at this property in the last 3 years? What carrier currently insures it and at what premium?
- What's the average days-on-market for RENTAL listings here right now (not sales)? A rising rental-DOM trend means longer vacancies and softer asking-rent achievability than the comps imply.
- What's the recent tenant-quality profile in this submarket — average credit score on applications, eviction rate, late-payment / NSF rate, and stable-employment percentage? A property-management company in the area should have these aggregated.
- How much new for-sale + rental construction is in the pipeline within 1–3 miles? Heavy new supply typically softens prices + rents 12–24 months out; constrained supply supports both.
CashFlowRE · CFR-S1CSZZ708MWXJ7
· Data 2 weeks ago
cashflowre.app · 2026-05-29