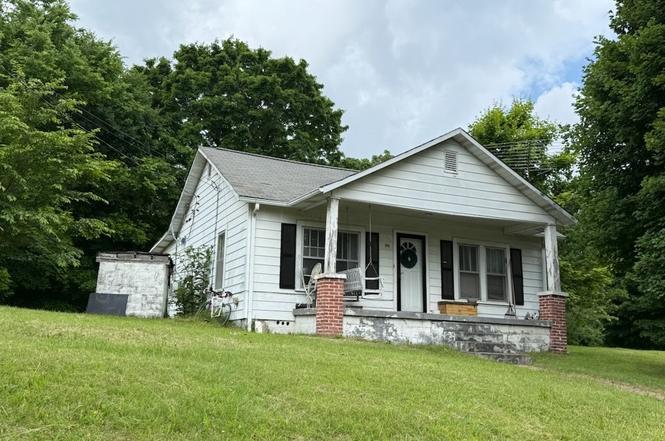
1910 River Rd · Clarksville, TN
Flood risk 1/10 · Minimal
- FEMA flood zone
- X (unshaded)
- Chance of flooding over 30 yrs
- 0.0%
- Est. flood insurance / yr
- $473 – $860
Fire risk 3/10 · Minor
- Est. fire insurance / yr
- $949 – $1,763
Heat risk 5/10 · Moderate
- Hot days now (above 108°F)
- 7 days/yr
- Hot days in 30 yrs
- 20 days/yr
Wind risk 4/10 · Minor
- Chance of severe wind over 30 yrs
- 9.0%
Air-quality risk 1/10 · Minimal
- Unhealthy air days now
- 0 days/yr
- Unhealthy air days in 30 yrs
- 0 days/yr
Risk factors via First Street. Map © Google.
Why this score? — see what drove the B- grade
The composite is a weighted blend of 9 inputs, each scored 0–100. Each bar is that input's sub-score; the figure is the points it added to the 100-point composite (weight × sub-score).
- Cash flow +30.0/30.0
- 1% rule +10.0/10.0
- DSCR +10.0/10.0
- ARV discount +7.5/15.0
- Livability +4.2/5.0
- Rent growth +2.8/5.0
- Schools +2.5/10.0
- Condition / age +2.5/5.0
- Appreciation +0.0/10.0
$90,000
🖨 Deal sheet 📄 Offer letter ✓ Due diligence
Listing remarks
1.70 Acres!!+/- No Restrictions and No HOA—plenty of room, mature trees, and no rear neighbors for privacy. Perfect spot to keep your trailers, RVs, boats, or whatever toys you’ve got. Located in the Montgomery Central school district!!
Key facts
- 1.5 acre lot
- Built 1930
- Listed 288 days
Property features AI
Exterior
- Parking: No covered spaces; No dedicated parking total listed
- Utilities: Private water source; Septic tank sewer
- Home design: Single-family residence; One story; Residential property
- Construction: Wood siding exterior; Existing year built; Other foundation
- Exterior features: 1.5-acre lot; Water available
Interior
- Kitchen: Oven included
- Bedrooms: 2 bedrooms (both on the main level)
- Flooring: Carpet
- Bathrooms: 1 full bathroom
- Heating & cooling: Has heating (type: Other); Wall/window cooling units
- Interior features: Oven; Carpet flooring; Crawl space basement
Neighborhood map
What this means for you Summary
Snapshot
- This is a 2-bed/1.0-bath single-family listed at $90k.
Deal economics
- At list price, monthly cash flow is $490 ($6k/yr) — positive.
- The deal already cash-flows at list — no discount required.
- Meets the 1% rule at list price ($1k rent vs $90k).
- Recommended offer: $79k (12.0% below list) — sets the bar for market timing.
- Cap rate 12.8% vs local median 3.5% in Clarksville — top-decile yield for the area; either an underpriced asset or a hidden risk that comps aren't pricing in. Stress-test before assuming the spread holds.
Location & tenants
- Location reads 84/100 on livability (#1 in TN, #798 nationally) — a professional / high-income tenant draw. Strengths: amenities A+, commute A+, cost of living A+; Watch: employment C-, crime D+.
- Montgomery County (urban): math 25% / reading 31% proficiency, ranked #65 of 139 in TN (top 47%) — low school quality limits family demand, transient renter base, plan for 1-2y turnover.
- Zoned schools: Cumberland Heights Elementary (math 45% / reading 34%, grade F, #231 of 952 statewide, top 26%, 592 students, 0% FRL); Montgomery Central High (math 6% / reading 40%, grade F, #149 of 332 statewide, top 46%, 1,056 students, 0% FRL) — zoned schools average 0% FRL vs 40% district-wide (40 pts lower); this property's tenant base skews higher-income than the district average.
- Market conditions: Rents rising (+1.3%/yr); 604 active listings in the ZIP; 2 comparable units currently listed for rent nearby; 2,583 units permitted in Montgomery County in 2024 (617 in 5+ unit buildings).
Forward outlook
- Local home prices are declining (-3.0%/yr); year-one equity from $622 of loan paydown is wiped out by about $3k of value loss. Plan a longer hold.
- Montgomery County population projected at +49% by 2050 — long-run rental-demand tailwind backs the buy-and-hold thesis.
- At projected returns (-3.0% appreciation + 1.3% rent growth), your $25k cash investment doubles in ~6 years — after that, you're playing with house money.
Negotiation context
- It's been on market 288 days — a 12% lower offer ($79k) is reasonable based on typical stale-listing flexibility.
Risks & watch-outs
- Watch-outs: built in 1930 — expect roof / HVAC / electrical / plumbing capex.
- Climate carrying-cost: extreme-heat days projected 7→20/yr by 2055 (HVAC capex compounding) — expect insurance premiums to compound above CPI over the hold.
Questions for the listing agent
- It's been on market 288 days. Have you received any prior offers? Is the seller open to a 12% concession, seller financing, or rate buy-down credit?
- Built in 1930 — when were the roof, HVAC, electrical panel, plumbing, and water heater last replaced?
- Why hasn't it sold? Are there any deal-killer items the seller is aware of (foundation, flood, title, zoning, code violations)?
- Is there a deadline driving the sale (1031 exchange, divorce, estate, relocation)? That informs how much negotiation room exists.
- Crime grade is D in this area — have there been break-ins, vandalism, or insurance claims at this property in the last 3 years? What carrier currently insures it and at what premium?
- What's the average days-on-market for RENTAL listings here right now (not sales)? A rising rental-DOM trend means longer vacancies and softer asking-rent achievability than the comps imply.
- What's the recent tenant-quality profile in this submarket — average credit score on applications, eviction rate, late-payment / NSF rate, and stable-employment percentage? A property-management company in the area should have these aggregated.
- How much new for-sale + rental construction is in the pipeline within 1–3 miles? Heavy new supply typically softens prices + rents 12–24 months out; constrained supply supports both.
Investment metrics
- 1% rule
- 1.56% ✓
- Cap rate
- 12.83%
- Cash-on-cash
- 23.34%
- DSCR
- 2.04
- GRM
- 5.3
CMA / ARV
- ARV (on-the-fly)
- $244,720
- Comps found
- 9
Show comp detail 9 sales within ~0.75 mi
| Address | Dist | Beds/Ba | Sqft | Sold | Price | $/sf | Match |
|---|---|---|---|---|---|---|---|
| 1910 River Rd | 0.00mi | 2/1.0 | 1,064 (0%) | 0mo | $80,000 | $75 | 100 |
| 1916 River Rd | 0.02mi | 3/2.0 (+1) | 1,156 (+9%) | 6mo | $310,000 | $268 | 70 |
| 2032 Dinsmore Rd | 0.30mi | 3/2.0 (+1) | 1,092 (+3%) | 18mo | $260,000 | $238 | 58 |
| 575 Palmyra Rd | 0.46mi | 3/1.0 (+1) | 1,056 (-1%) | 22mo | $214,900 | $204 | 54 |
| 1756 Cumberland Heights Rd | 0.67mi | 3/2.0 (+1) | 1,040 (-2%) | 5mo | $220,000 | $212 | 51 |
| 2139 River Rd | 0.58mi | 2/1.0 | 1,032 (-3%) | 22mo | $222,000 | $215 | 49 |
| 213 Wayne Hall Rd | 0.53mi | 3/2.0 (+1) | 1,214 (+14%) | 18mo | $282,000 | $232 | 28 |
| 229 Wayne Hall Rd | 0.58mi | 3/2.0 (+1) | 1,214 (+14%) | 16mo | $279,000 | $230 | 27 |
| 237 Wayne Hall Rd | 0.60mi | 3/2.0 (+1) | 1,214 (+14%) | 20mo | $295,000 | $243 | 23 |
Match score weights: distance 35% · size 25% · config 20% · recency 20%. Top-matched comps best support the ARV.
Projected returns pro-forma
-3.0% appreciation · 1.32% rent growth · sell at horizon
- IRR
- 14.5%
- Equity multiple
- 1.57×
- Total profit
- $14,310
- Equity at exit
- $13,419
- IRR
- 21.9%
- Equity multiple
- 2.72×
- Total profit
- $43,454
- Equity at exit
- $7,782
Cash invested: $25,200 (down + closing). Projections, not guarantees.
Landlord ↔ Tenant lean methodology
- Overall (STATE)
- 87 Strongly Landlord-Friendly
- State Tennessee
- 87 Strongly Landlord-Friendly · R+13
- County
- — inherits STATE
- City
- — inherits STATE
ZIP-level market 37040
- Home prices YoY
- -22.0%
- Rents YoY
- 1.3%
- Active inventory
- 604
- Price-to-rent
- 5.3×
Monthly cashflow live
- Estimated rent
- $1,408 medium interval (Pro) →
- Mortgage (P&I)
- −$472
- Tax est. 1.5%
- −$112 /mo · $1,350/yr
- Insurance
- −$38
- HOA
- −$0
- Vacancy / Maint / Mgmt
- −$296
- Net cashflow
- $490
Break-even live
UW: 25.0% down · 7.5% · 30yr · 1.5% tax · 5.0% vac · 8.0% maint · 8.0% mgmt
Financing live
Cash to close
- Down payment
- $22,500
- Closing costs
- $2,700
- Reserves months
- —
- Total cash needed
- —
Loan-product check · same deal, 3 products live
Conventional
25% down · 7.5% · 30yr
- Down + closing
- —
- Monthly P&I
- —
- Monthly cashflow
- —
- DSCR
- —
- Eligible?
- —
Personal DTI + credit; lowest rate.
DSCR
20% down · 8.5% · 30yr
- Down + closing
- —
- Monthly P&I
- —
- Monthly cashflow
- —
- DSCR
- —
- Eligible?
- —
No personal income docs; deal must DSCR.
Hard money
10% down · 12.0% · 12mo
- Down + closing
- —
- Monthly P&I
- —
- Monthly cashflow
- —
- DSCR
- —
- Eligible?
- —
Short-term bridge; refi at stabilization.
Rent comps 2 comps
| Address | Beds | Baths | Sqft | Rent | $/sqft | DOM | Units | Dist |
|---|---|---|---|---|---|---|---|---|
| 150 Mayhew Rd Unit D7 Clarksville, TN | 2.0 | 1.0 | 800 | $950 | $1.19 | 21d | 1 | 1.09mi |
| 474 Indian Overlook Clarksville, TN | 3.0 | 2.5 | 1443 | $2,000 | $1.39 | 21d | 1 | 1.13mi |
Listing history 7 events
-
2026-06-02statusdays on market $90,000 Pending 288 DOM
-
2026-05-31days on market $90,000 Active Under Contract 287 DOM
-
2026-05-30days on market $90,000 Active Under Contract 286 DOM
-
2025-09-08historical Active Under Contract
-
2025-08-25price $90,000
-
2025-08-18$100,000 Active
-
2025-07-30historical $100,000
ⓘ Source: listings_history table (triggers on properties + properties_extension) + one-shot
backfill from property_details.listing_events for pre-trigger history.
Climate risk First Street
- Flood 1/10 Low FEMA zone X (unshaded) · 0% chance over 30 yrs
- Wildfire 3/10 Moderate
- Heat 5/10 Major 7 d/yr ≥108°F today · 20 d/yr by 30 yrs out
- Wind 4/10 Moderate 9% chance of damaging wind over 30 yrs
- Air quality 1/10 Low 0 unhealthy d/yr today · 0 by 30 yrs out
Nearby sold comps map
Loading sold comps map…
Walkable amenities ~0.75 mi
Loading nearby amenities…
Taxation est. · year 1
- Rental income
- $16,892
- − Mortgage interest
- −$5,041
- − Property taxes
- −$1,350
- − Insurance
- −$450
- − Repairs & maintenance
- −$1,351
- − Management
- −$1,351
- − Depreciation
- −$2,618
- Taxable income
- $4,730
- Est. tax owed @ 24.0%
- −$1,135
- After-tax cash flow
- $4,746/yr
For passive investors: Depreciation is non-cash, so a rental often shows a tax loss while cash-flowing — sheltering income. Rental losses are passive: they offset passive income freely, and up to $25,000/yr can offset ordinary (W-2) income if you actively participate and your MAGI is under $100k (phasing out to $0 by $150k); unused losses carry forward. On sale, claimed depreciation is recaptured at up to 25%, and gains may owe capital-gains tax (a 1031 exchange can defer both). Figures are a year-1 estimate at your 24.0% rate — not tax advice; consult a CPA.
Schools (NCES district)
- District
- Montgomery County
- NCES district ID
- 4703030
- Math proficiency
- 25% ▼ -20.00%
- Reading proficiency
- 31% ▼ -10.00%
- Median HH income
- $50,423
- Composite
- 24.56/100
- National rank
- #7641
- State rank
- #65 of 139 in TN
Livability — Clarksville
- Score
- 84/100
- State rank
- #1
- US rank
- #798
Category grades
Schools grade is shown separately in the Schools card above.
Census & demographics
- County
- Montgomery County · 211,371 people
- City population
- 211,371
- Metro
- Clarksville, TN-KY
- Population (ZIP)
- 64,977
- Household income
- $67,745
- Rent vs Own
- Severe rent burden
- 2670.0
Population outlook (Montgomery County) Hauer SSP2
- Today (2025)
- 236,633 people
- By 2030
- 258,978 · +9.4%
- By 2040
- 305,456 · +29.1%
- By 2050
- 353,147 · +49.2%
- By 2075
- 471,289 · +99.2%
- By 2100
- 564,122 · +138.4%
Race, ethnicity, and origin ACS 2023
- Neighborhood character
- Diverse neighborhood (Simpson 0.61)
- Race & ethnicity
- White 56% Black 25% Two or more races 11% Hispanic / Latino 10% Asian 2%
- Hispanic origin (detail)
- Mexican 6% Puerto Rican 2%
- Common ancestry
- Italian 4% Lithuanian 1% Slovak 1%
- Foreign-born
- 6% · Canada, South Korea
- Languages at home
- 90% English-only · Spanish 5% Other Asian/Pacific 1% Other Indo-European 1%
Political lean MEDSL · Montgomery
- 2024 margin
- R (+18.4) · D 40.0% · R 58.5% · Other 1.5%
- 2008→2024 swing
- -10.5pp toward R · 2008: -7.9pp · 2024: -18.4pp
- All cycles
- 2024: R+18.4 2020: R+12.7 2016: R+18.6 2012: R+10.5 2008: R+7.9
Not yet ingested
- Civics
- —
Market trends
- HPI YoY
- ▼ -75.79%
- Current HPI
- 269.0601
- Rent YoY
- ▲ 1.32%
- Metro
- Clarksville, TN-KY
- State GDP YoY
- ▲ 2.78%
- F500 in state
- 22
Industry mix (Fortune 500 HQ in TN)
| Industry | F500 HQs | Revenue |
|---|---|---|
| Healthcare | 3 | $91B |
|
||
| Retail | 3 | $72B |
|
||
| Transportation / Logistics | 1 | $88B |
|
||
| Paper / Packaging | 1 | $19B |
|
||
| Insurance | 1 | $13B |
|
||
| Energy | 1 | $12B |
|
||
Price history
-10.0% since first listed4 events — show timeline
- 2025-09-08 Contingent — REALTRACS as Distributed by MLS Grid
- 2025-08-25 Price Changed $90,000 REALTRACS as Distributed by MLS Grid
- 2025-08-18 Listed $100,000 REALTRACS as Distributed by MLS Grid
- 2025-07-30 Coming Soon $100,000 REALTRACS as Distributed by MLS Grid
Cash-flow waterfall
monthlySold comps — $/sqft
last 12 mo · ≤1 miLoading sold comps…