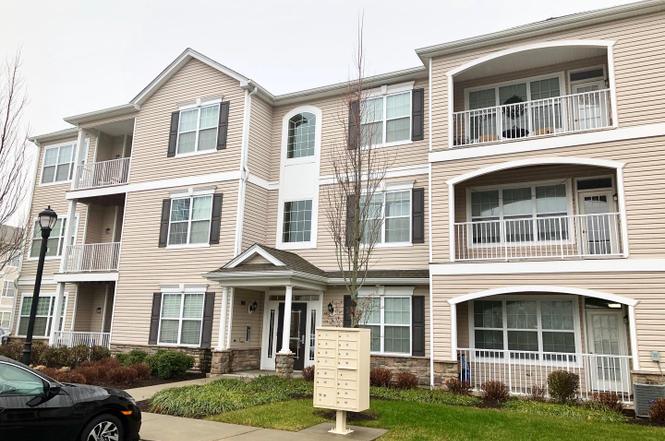
632 Timberlake Dr
The College of New Jersey, NJ 08618
$171,250C-
3 bd · 2.0 ba ·
1,464 sqft ·
Built 2012
· Condo
· Pending
· 26 DOM
Cashflow @ list (25.0% down · 7.5%)
Estimated rent
$2,483/mo
Mortgage (P&I)
−$898
Tax + insurance
−$504
HOA
−$389
Vac / Maint / Mgmt
−$521
Net cashflow
$171/mo
Annual
$2,046/yr
Cap rate
7.49%
Cash-on-cash
4.27%
DSCR
1.19
1% rule
1.45%
Cash to close
$47,950
Investor read
- This is a 3-bed/2.0-bath condo listed at $171k.
- At list price, monthly cash flow is $171 ($2k/yr) — positive.
- The deal already cash-flows at list — no discount required.
- Meets the 1% rule at list price ($2k rent vs $171k).
- It's been on market 26 days — a 2% lower offer ($169k) is reasonable based on typical stale-listing flexibility.
- Recommended offer: $169k (1.5% below list) — sets the bar for market timing.
- Local home prices are declining (-3.0%/yr); year-one equity from $1k of loan paydown is wiped out by about $5k of value loss. Plan a longer hold.
- Location reads: area grade C — affects rentability + tenant quality, not the cash-flow math above.
- Ewing Township School District (suburban): math 16% / reading 37% proficiency, ranked #358 of 472 in NJ (top 76%) — low school quality limits family demand, transient renter base, plan for 1-2y turnover.
- Watch-outs: property tax is 3.0% of price.
- Market conditions: Rents rising (+2.6%/yr); 144 active listings in the ZIP; 4 comparable units currently listed for rent nearby; rentals at typical pace (median 21d on market — plan ~3-4 weeks tenant-placement turnaround); 2,256 units permitted in Mercer County in 2024 (1,303 in 5+ unit buildings).
- Mercer County population projected at +4% by 2050 — modest demand growth; plan on rents tracking national, not racing it.
- 3 sale attempts since 10y ago with the ask held roughly flat each time — persistent listings suggest the price (not the market) is what's stuck; bring a comps-based counter.
- Climate carrying-cost: major wind risk, 27% chance of damaging wind over 30y; extreme-heat days projected 7→15/yr by 2055 (HVAC capex compounding) — expect insurance premiums to compound above CPI over the hold.
- Cap rate 7.5% vs local median 3.4% in The College of New Jersey — top-decile yield for the area; either an underpriced asset or a hidden risk that comps aren't pricing in. Stress-test before assuming the spread holds.
- At $2,483/mo this rent would consume 59% of the median local household income ($50k/yr) (locally 2116% of renters already pay >50% of income on rent) — very limited rent-growth headroom before tenants either downsize or default.
Questions for listing agent
- Property tax is high relative to price — has the assessment been appealed recently, and will the sale trigger a re-assessment?
- What does the HOA fee cover, when was the last increase, and are there any pending special assessments or reserve-fund shortfalls?
- Any open or pending special assessments — roof, HVAC, plumbing, elevator, façade? What's the per-unit balance and payoff schedule, and is the seller paying it off at close or rolling it to the buyer?
- Is there a deadline driving the sale (1031 exchange, divorce, estate, relocation)? That informs how much negotiation room exists.
- What's the average days-on-market for RENTAL listings here right now (not sales)? A rising rental-DOM trend means longer vacancies and softer asking-rent achievability than the comps imply.
- What's the recent tenant-quality profile in this submarket — average credit score on applications, eviction rate, late-payment / NSF rate, and stable-employment percentage? A property-management company in the area should have these aggregated.
- How much new apartment / multifamily construction is in the pipeline within 1–3 miles? Heavy new supply (>2% of stock underway) typically softens rents 12–24 months out; light construction supports rent growth.
CashFlowRE · CFR-S2EDSHC5W11FXS
· Data 6 days ago
cashflowre.app · 2026-05-29