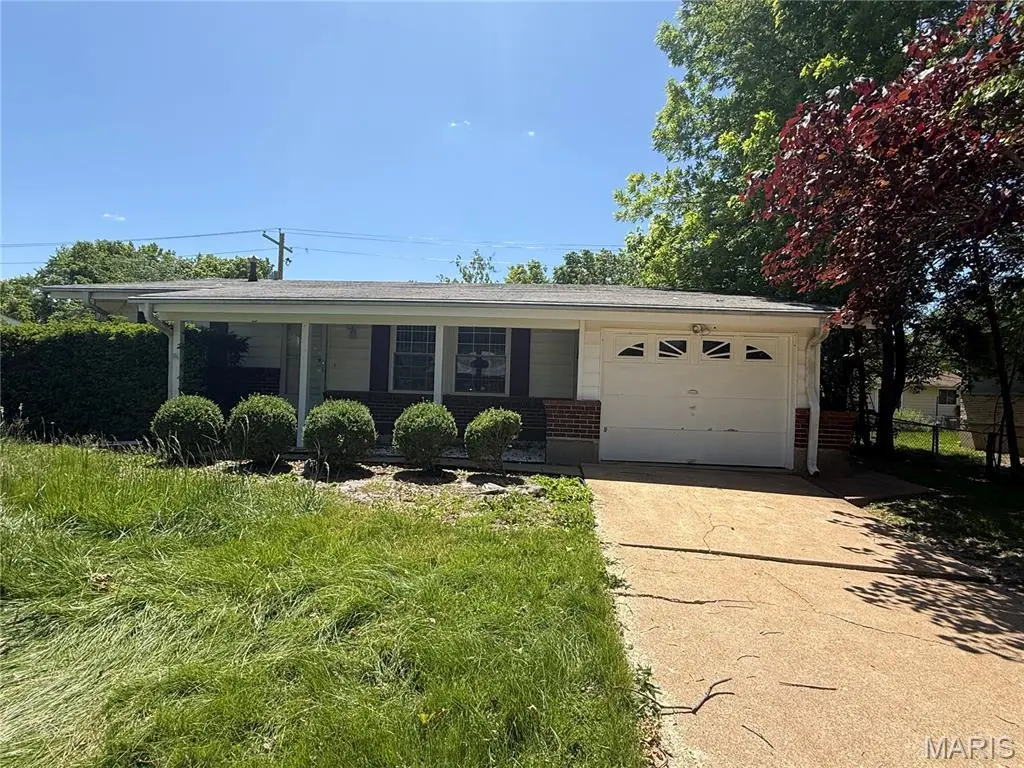
1328 Coppergate Ln
Spanish Lake, MO 63138
$104,900B-
3 bd · 1.5 ba ·
1,061 sqft ·
Built 1961
· SingleFamily
· Pending
· 3 DOM
Cashflow @ list (25.0% down · 7.5%)
Estimated rent
$1,416/mo
Mortgage (P&I)
−$550
Tax + insurance
−$187
HOA
−$0
Vac / Maint / Mgmt
−$297
Net cashflow
$381/mo
Annual
$4,575/yr
Cap rate
10.65%
Cash-on-cash
15.58%
DSCR
1.69
1% rule
1.35%
Cash to close
$29,372
Investor read
- This is a 3-bed/1.5-bath single-family listed at $105k.
- At list price, monthly cash flow is $381 ($5k/yr) — positive.
- The deal already cash-flows at list — no discount required.
- Meets the 1% rule at list price ($1k rent vs $105k).
- Only 3 days on market — expect competitive offers; lowballing is unlikely to land.
- Local home prices are declining (-3.0%/yr); year-one equity from $725 of loan paydown is wiped out by about $3k of value loss. Plan a longer hold.
- Location reads 51/100 on livability (#870 in MO) — a working-class tenant base; expect higher turnover. Strengths: cost of living A+, housing A+; Watch: crime F, amenities F, commute F.
- Hazelwood (suburban): math 11% / reading 26% proficiency, ranked #306 of 324 in MO (top 94%) — low school quality limits family demand, transient renter base, plan for 1-2y turnover.
- Zoned schools: Twillman Elem. (math 2% / reading 8%, grade F, #1,072 of 1,115 statewide, top 98%, 326 students, 99% FRL); Hazelwood Central High (math 12% / reading 33%, grade F, #455 of 521 statewide, top 88%, 1,628 students, 52% FRL) — zoned schools average 76% FRL vs 53% district-wide (22 pts higher); higher-poverty schools than district average — tighter screening recommended.
- Market conditions: Rents soft (-1.5%/yr); 101 active listings in the ZIP; 40 comparable units currently listed for rent nearby; rentals at typical pace (median 24d on market — plan ~3-4 weeks tenant-placement turnaround); 920 units permitted in St. Louis County in 2024 (250 in 5+ unit buildings).
- 2 sale attempts with the ask held roughly flat each time — persistent listings suggest the price (not the market) is what's stuck; bring a comps-based counter.
- Current owner paid $76k; 37% above their basis — modest negotiation headroom, anchor on the comps not their cost.
- Climate carrying-cost: extreme-heat days projected 7→21/yr by 2055 (HVAC capex compounding) — expect insurance premiums to compound above CPI over the hold.
- Cap rate 10.7% vs local median 7.9% in Spanish Lake — top-decile yield for the area; either an underpriced asset or a hidden risk that comps aren't pricing in. Stress-test before assuming the spread holds.
- This rent runs 30% of the median local income ($56k/yr) — at the standard rent-burdened threshold; future hikes will face affordability resistance.
Questions for listing agent
- Built in 1961 — when were the roof, HVAC, electrical panel, plumbing, and water heater last replaced?
- Is there a deadline driving the sale (1031 exchange, divorce, estate, relocation)? That informs how much negotiation room exists.
- Schools are F-rated, which usually means shorter tenancies and higher turnover. Who's the typical renter profile here, and what's been the actual vacancy rate?
- Crime grade is F in this area — have there been break-ins, vandalism, or insurance claims at this property in the last 3 years? What carrier currently insures it and at what premium?
- What's the average days-on-market for RENTAL listings here right now (not sales)? A rising rental-DOM trend means longer vacancies and softer asking-rent achievability than the comps imply.
- What's the recent tenant-quality profile in this submarket — average credit score on applications, eviction rate, late-payment / NSF rate, and stable-employment percentage? A property-management company in the area should have these aggregated.
- How much new for-sale + rental construction is in the pipeline within 1–3 miles? Heavy new supply typically softens prices + rents 12–24 months out; constrained supply supports both.
CashFlowRE · CFR-S2FTB63AF88XH1
· Data 3 weeks ago
cashflowre.app · 2026-05-29