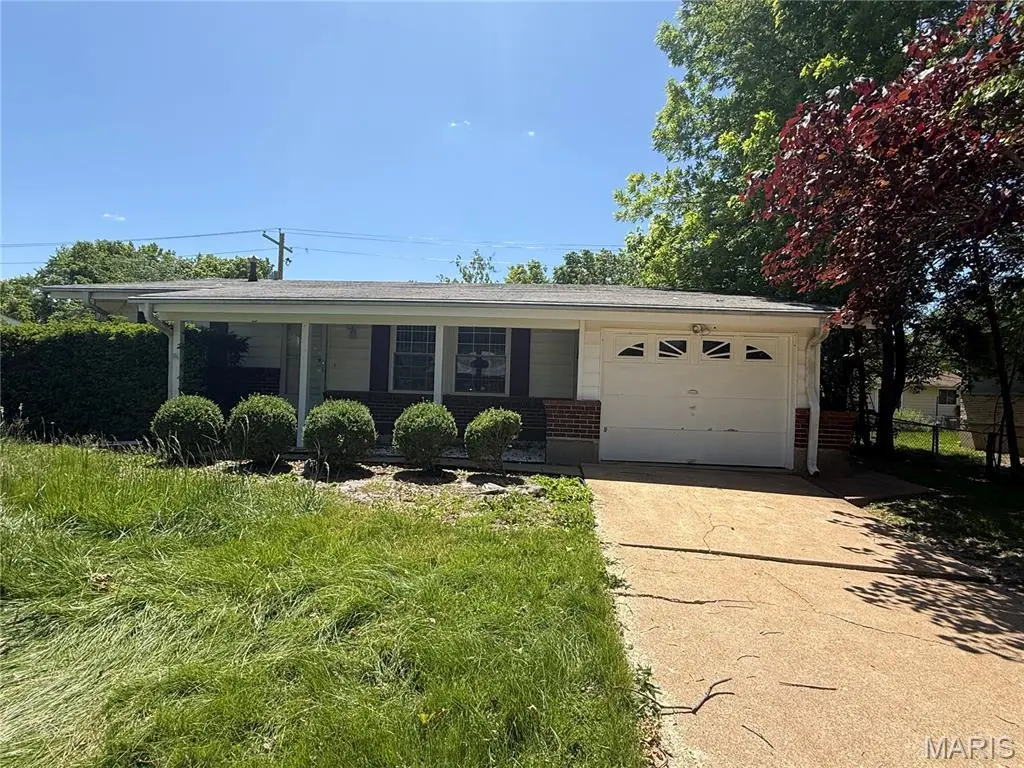
1328 Coppergate Ln · Spanish Lake, MO
Flood risk 1/10 · Minimal
- FEMA flood zone
- X (unshaded)
- Chance of flooding over 30 yrs
- 0.0%
- Est. flood insurance / yr
- $473 – $860
Fire risk 1/10 · Minimal
- Est. fire insurance / yr
- $1,054 – $1,958
Heat risk 5/10 · Moderate
- Hot days now (above 107°F)
- 7 days/yr
- Hot days in 30 yrs
- 21 days/yr
Wind risk 2/10 · Minimal
- Chance of severe wind over 30 yrs
- 1.0%
Air-quality risk 4/10 · Minor
- Unhealthy air days now
- 4 days/yr
- Unhealthy air days in 30 yrs
- 5 days/yr
Risk factors via First Street. Map © Google.
Why this score? — see what drove the B- grade
The composite is a weighted blend of 9 inputs, each scored 0–100. Each bar is that input's sub-score; the figure is the points it added to the 100-point composite (weight × sub-score).
- Cash flow +29.7/30.0
- DSCR +10.0/10.0
- ARV discount +9.7/15.0
- 1% rule +8.5/10.0
- Livability +2.6/5.0
- Condition / age +2.5/5.0
- Rent growth +2.1/5.0
- Schools +1.7/10.0
- Appreciation +0.0/10.0
$104,900
🖨 Deal sheet 📄 Offer letter ✓ Due diligence
Listing remarks MLS
Welcome to this well-located home in a quiet, established neighborhood of North St. Louis County. The property offers a functional floor plan with comfortable living spaces and good natural light throughout. A spacious yard provides room for outdoor enjoyment, gardening, or future enhancements. Conveniently situated near shopping, dining, schools, and major roadways, this home offers easy access to everyday amenities while maintaining a residential feel. A great opportunity for buyers seeking value and potential in the Hazelwood School District area.
Key facts
- Hardwood flooring
- Covered front porch
- Custom wet bar
Tags
Property features AI
Finance
- Financial info: Lease not considered
Exterior
- Parking: Attached garage (1 car)
- Utilities: Public water; Public sewer; Electric service by Ameren; Natural gas connected; Cable available; Phone available; Electricity connected; Sewer connected; Water connected
- Home design: Single-family residence; One level
- Construction: Brick veneer and vinyl siding exterior
- Exterior features: Near public transit
Interior
- Kitchen: Kitchen on main level
- Bedrooms: Three bedrooms on the main level
- Bathrooms: One full bathroom (main level); One half bathroom (main level)
- Heating & cooling: Forced air heating; Central air conditioning; Ceiling fan(s)
- Interior features: Full basement with 8 ft+ poured concrete; Basement
Neighborhood map
What this means for you Summary
Snapshot
- This is a 3-bed/1.5-bath single-family listed at $105k.
Deal economics
- At list price, monthly cash flow is $381 ($5k/yr) — positive.
- The deal already cash-flows at list — no discount required.
- Meets the 1% rule at list price ($1k rent vs $105k).
- Cap rate 10.7% vs local median 7.9% in Spanish Lake — top-decile yield for the area; either an underpriced asset or a hidden risk that comps aren't pricing in. Stress-test before assuming the spread holds.
Location & tenants
- Location reads 51/100 on livability (#870 in MO) — a working-class tenant base; expect higher turnover. Strengths: cost of living A+, housing A+; Watch: crime F, amenities F, commute F.
- Hazelwood (suburban): math 11% / reading 26% proficiency, ranked #306 of 324 in MO (top 94%) — low school quality limits family demand, transient renter base, plan for 1-2y turnover.
- Zoned schools: Twillman Elem. (math 2% / reading 8%, grade F, #1,072 of 1,115 statewide, top 98%, 326 students, 99% FRL); Hazelwood Central High (math 12% / reading 33%, grade F, #455 of 521 statewide, top 88%, 1,628 students, 52% FRL) — zoned schools average 76% FRL vs 53% district-wide (22 pts higher); higher-poverty schools than district average — tighter screening recommended.
- Market conditions: Rents soft (-1.5%/yr); 101 active listings in the ZIP; 40 comparable units currently listed for rent nearby; rentals at typical pace (median 24d on market — plan ~3-4 weeks tenant-placement turnaround); 920 units permitted in St. Louis County in 2024 (250 in 5+ unit buildings).
- This rent runs 30% of the median local income ($56k/yr) — at the standard rent-burdened threshold; future hikes will face affordability resistance.
Forward outlook
- Local home prices are declining (-3.0%/yr); year-one equity from $725 of loan paydown is wiped out by about $3k of value loss. Plan a longer hold.
Negotiation context
- Only 3 days on market — expect competitive offers; lowballing is unlikely to land.
- 2 sale attempts with the ask held roughly flat each time — persistent listings suggest the price (not the market) is what's stuck; bring a comps-based counter.
- Current owner paid $76k; 37% above their basis — modest negotiation headroom, anchor on the comps not their cost.
Risks & watch-outs
- Climate carrying-cost: extreme-heat days projected 7→21/yr by 2055 (HVAC capex compounding) — expect insurance premiums to compound above CPI over the hold.
Questions for the listing agent
- Built in 1961 — when were the roof, HVAC, electrical panel, plumbing, and water heater last replaced?
- Is there a deadline driving the sale (1031 exchange, divorce, estate, relocation)? That informs how much negotiation room exists.
- Schools are F-rated, which usually means shorter tenancies and higher turnover. Who's the typical renter profile here, and what's been the actual vacancy rate?
- Crime grade is F in this area — have there been break-ins, vandalism, or insurance claims at this property in the last 3 years? What carrier currently insures it and at what premium?
- What's the average days-on-market for RENTAL listings here right now (not sales)? A rising rental-DOM trend means longer vacancies and softer asking-rent achievability than the comps imply.
- What's the recent tenant-quality profile in this submarket — average credit score on applications, eviction rate, late-payment / NSF rate, and stable-employment percentage? A property-management company in the area should have these aggregated.
- How much new for-sale + rental construction is in the pipeline within 1–3 miles? Heavy new supply typically softens prices + rents 12–24 months out; constrained supply supports both.
Investment metrics
- 1% rule
- 1.35% ✓
- Cap rate
- 10.65%
- Cash-on-cash
- 15.58%
- DSCR
- 1.69
- GRM
- 6.2
CMA / ARV
- ARV (on-the-fly)
- $110,344
- Comps found
- 12
Show comp detail 12 sales within ~0.75 mi
| Address | Dist | Beds/Ba | Sqft | Sold | Price | $/sf | Match |
|---|---|---|---|---|---|---|---|
| 1328 Coppergate Ln | 0.00mi | 3/1.5 | 1,061 (0%) | 0mo | $104,900 | $99 | 100 |
| 1316 Bayonne Dr | 0.15mi | 2/1.5 (-1) | 1,015 (-4%) | 2mo | $105,000 | $103 | 79 |
| 1524 Cove Ln | 0.62mi | 3/2.5 | 1,050 (-1%) | 6mo | $109,900 | $105 | 60 |
| 1459 Cove Ln | 0.61mi | 3/1.5 | 988 (-7%) | 3mo | $79,900 | $81 | 58 |
| 1072 Prigge Rd | 0.58mi | 3/1.5 | 960 (-10%) | 0mo | $99,900 | $104 | 57 |
| 1459 Redman Blvd | 0.66mi | 3/1.5 | 1,150 (+8%) | 2mo | $115,000 | $100 | 54 |
| 1141 June Ave | 0.54mi | 4/2.0 (+1) | 1,142 (+8%) | 4mo | $149,900 | $131 | 52 |
| 1219 Walker Ave | 0.52mi | 3/1.0 | 936 (-12%) | 6mo | $119,900 | $128 | 49 |
| 1370 Reale Ave | 0.48mi | 3/1.0 | 925 (-13%) | 6mo | $115,000 | $124 | 49 |
| 1516 Farmview Ave | 0.71mi | 3/1.5 | 1,156 (+9%) | 4mo | $130,000 | $112 | 49 |
| 1135 Cove Ln | 0.68mi | 2/1.0 (-1) | 936 (-12%) | 2mo | $85,000 | $91 | 40 |
| 1209 Cove Ln | 0.64mi | 4/1.0 (+1) | 1,176 (+11%) | 7mo | $99,000 | $84 | 40 |
Match score weights: distance 35% · size 25% · config 20% · recency 20%. Top-matched comps best support the ARV.
Projected returns pro-forma
-3.0% appreciation · 0.0% rent growth · sell at horizon
- IRR
- 2.9%
- Equity multiple
- 1.11×
- Total profit
- $3,163
- Equity at exit
- $15,641
- IRR
- 9.3%
- Equity multiple
- 1.62×
- Total profit
- $18,105
- Equity at exit
- $9,070
Cash invested: $29,372 (down + closing). Projections, not guarantees.
Landlord ↔ Tenant lean methodology
- Overall (STATE)
- 81 Strongly Landlord-Friendly
- State Missouri
- 81 Strongly Landlord-Friendly · R+10
- County
- — inherits STATE
- City
- — inherits STATE
ZIP-level market 63138
- Home prices YoY
- -31.0%
- Rents YoY
- -1.5%
- Active inventory
- 101
- Price-to-rent
- 6.2×
Monthly cashflow live
- Estimated rent
- $1,416 high interval (Pro) →
- Mortgage (P&I)
- −$550
- Tax from tax record
- −$143 /mo · $1,719/yr
- Insurance
- −$44
- HOA
- −$0
- Vacancy / Maint / Mgmt
- −$297
- Net cashflow
- $381
Break-even live
UW: 25.0% down · 7.5% · 30yr · 1.5% tax · 5.0% vac · 8.0% maint · 8.0% mgmt
Financing live
Cash to close
- Down payment
- $26,225
- Closing costs
- $3,147
- Reserves months
- —
- Total cash needed
- —
Loan-product check · same deal, 3 products live
Conventional
25% down · 7.5% · 30yr
- Down + closing
- —
- Monthly P&I
- —
- Monthly cashflow
- —
- DSCR
- —
- Eligible?
- —
Personal DTI + credit; lowest rate.
DSCR
20% down · 8.5% · 30yr
- Down + closing
- —
- Monthly P&I
- —
- Monthly cashflow
- —
- DSCR
- —
- Eligible?
- —
No personal income docs; deal must DSCR.
Hard money
10% down · 12.0% · 12mo
- Down + closing
- —
- Monthly P&I
- —
- Monthly cashflow
- —
- DSCR
- —
- Eligible?
- —
Short-term bridge; refi at stabilization.
Rent comps 40 comps
| Address | Beds | Baths | Sqft | Rent | $/sqft | DOM | Units | Dist |
|---|---|---|---|---|---|---|---|---|
| 1310 Petite Dr Saint Louis, MO | 3.0 | 1.5 | 1407 | $1,495 | $1.06 | 23d | 1 | 0.09mi |
| 11185 Oak Parkway Ln St. Louis, MO | 2.0–3.0 | 2.0 | 1412 | $1,075 | $0.76 | 1d | 1 | 0.44mi |
| 1141 Scott Ave Saint Louis, MO | 3.0 | 1.0 | 864 | $1,400 | $1.62 | 21d | 1 | 0.47mi |
| 11726 Criterion Ave Saint Louis, MO | 3.0 | 2.0 | 1205 | $1,420 | $1.18 | 23d | 1 | 0.48mi |
| 1172 June Ave Saint Louis, MO | 4.0 | 2.0 | 1142 | $1,400 | $1.23 | 43d | 1 | 0.51mi |
| 1218 Walker Ave Saint Louis, MO | 3.0 | 1.0 | 936 | $1,275 | $1.36 | 23d | 1 | 0.52mi |
| 1223 Walker Ave Saint Louis, MO | 4.0 | 1.0 | 936 | $1,800 | $1.92 | 43d | 1 | 0.54mi |
| 1376 Cove Ln Saint Louis, MO | 3.0 | 1.0 | 925 | $1,365 | $1.48 | 23d | 1 | 0.56mi |
| 1359 Cove Ln Saint Louis, MO | 3.0 | 1.0 | 925 | $1,427 | $1.54 | 1d | 1 | 0.59mi |
| 1504 Redman Blvd Saint Louis, MO | 3.0 | 2.0 | 1014 | $1,299 | $1.28 | 4d | 1 | 0.67mi |
| 11891 Bridgevale Ave Saint Louis, MO | 3.0 | 1.0 | 864 | $1,350 | $1.56 | 23d | 1 | 0.69mi |
| 1459 Redman Blvd Saint Louis, MO | 4.0 | 1.5 | 1150 | $1,550 | $1.35 | 20d | 1 | 0.69mi |
| 1132 Redman Blvd Saint Louis, MO | 4.0 | 1.0 | 1080 | $1,195 | $1.11 | 43d | 1 | 0.73mi |
| 1516 Farmview Ave Saint Louis, MO | 3.0 | 1.5 | 1156 | $1,295 | $1.12 | 43d | 1 | 0.74mi |
| 1202 Laredo Ave Saint Louis, MO | 3.0 | 2.0 | 1152 | $1,450 | $1.26 | 16d | 1 | 0.79mi |
| 941 Pike Ct St. Louis, MO | 3.0 | 1.5 | 1431 | $1,255 | $0.88 | 3d | 1 | 0.81mi |
| 941 Pike Ct St. Louis, MO | 3.0 | 1.5 | 1431 | $1,255 | $0.88 | 23d | 1 | 0.81mi |
| 11930 Criterion Ave Saint Louis, MO | 3.0 | 1.0 | 816 | $1,350 | $1.65 | 43d | 1 | 0.84mi |
| 1455 Broadlawns Ln Saint Louis, MO | 3.0 | 1.0 | 912 | $1,395 | $1.53 | 12d | 1 | 0.87mi |
| 1473 Broadlawns Ln Saint Louis, MO | 3.0 | 1.0 | 1000 | $1,400 | $1.40 | 43d | 1 | 0.88mi |
| 11921 Larimore Rd Saint Louis, MO | 3.0 | 1.0 | 1078 | $1,100 | $1.02 | 43d | 1 | 0.97mi |
| 12035 Krenning Ln Saint Louis, MO | 3.0 | 1.0 | 1170 | $1,125 | $0.96 | 23d | 1 | 1.05mi |
| 1708 San Remo Ct St. Louis, MO | 1.0–3.0 | 1.0–1.5 | 1053 | $1,300 | $1.23 | 1d | 9 | 1.09mi |
| 10421 Gardo Ct Saint Louis, MO | 3.0 | 2.0 | 1000 | $1,395 | $1.40 | 14d | 1 | 1.21mi |
| 10527 Prestwick Dr Saint Louis, MO | 3.0 | 2.0 | 854 | $1,395 | $1.63 | 7d | 1 | 1.24mi |
| 1205 Shepley Dr Saint Louis, MO | 3.0 | 1.0 | 901 | $1,350 | $1.50 | 43d | 1 | 1.26mi |
| 1205 Shepley Dr Saint Louis, MO | 3.0 | 1.0 | 901 | $1,325 | $1.47 | 23d | 1 | 1.26mi |
| 10508 Druid Dr Saint Louis, MO | 3.0 | 1.0 | 1122 | $1,475 | $1.31 | 16d | 1 | 1.27mi |
| 10518 Gretna Cir Saint Louis, MO | 3.0 | 1.0 | 1082 | $1,450 | $1.34 | 23d | 1 | 1.27mi |
| 10524 Durness Dr Saint Louis, MO | 3.0 | 1.0 | 1000 | $1,250 | $1.25 | 43d | 1 | 1.29mi |
| 1208 Rapid Dr Saint Louis, MO | 3.0 | 1.0 | 992 | $1,375 | $1.39 | 4d | 1 | 1.30mi |
| 1321 Dominica Dr Saint Louis, MO | 3.0 | 1.0 | 1012 | $1,400 | $1.38 | 43d | 1 | 1.31mi |
| 10519 Renfrew Dr Saint Louis, MO | 3.0 | 1.5 | 982 | $1,399 | $1.42 | 43d | 1 | 1.32mi |
| 257 Glen Garry Rd Saint Louis, MO | 3.0 | 1.0 | 873 | $1,025 | $1.17 | 14d | 1 | 1.32mi |
| 743 Shepley Dr Saint Louis, MO | 3.0 | 1.0 | 932 | $1,025 | $1.10 | 7d | 1 | 1.33mi |
| 1911 Redman Rd Saint Louis, MO | 3.0 | 1.0 | 1454 | $1,495 | $1.03 | 1d | 1 | 1.33mi |
| 10650 Dunkeld Cir Saint Louis, MO | 3.0 | 1.0 | 854 | $1,250 | $1.46 | 7d | 1 | 1.34mi |
| 409 Shepley Dr Saint Louis, MO | 3.0 | 1.0 | 854 | $1,095 | $1.28 | 4d | 1 | 1.35mi |
| 457 Shepley Dr Saint Louis, MO | 3.0 | 1.0 | 854 | $1,350 | $1.58 | 23d | 1 | 1.36mi |
| 10617 Dunkeld Cir Saint Louis, MO | 3.0 | 1.0 | 873 | $1,299 | $1.49 | 7d | 1 | 1.36mi |
Listing history 14 events
-
2026-05-19status Pending
-
2026-05-16$104,900 Active
-
2026-05-16price $104,900
-
2026-05-16historical $105,000
-
2026-02-25soldstatus Closed 556-char remark
Show marketing remark (556 chars)
Welcome to this well-located home in a quiet, established neighborhood of North St. Louis County. The property offers a functional floor plan with comfortable living spaces and good natural light throughout. A spacious yard provides room for outdoor enjoyment, gardening, or future enhancements. Conveniently situated near shopping, dining, schools, and major roadways, this home offers easy access to everyday amenities while maintaining a residential feel. A great opportunity for buyers seeking value and potential in the Hazelwood School District area.
-
2026-02-02status Pending 556-char remark
Show marketing remark (556 chars)
Welcome to this well-located home in a quiet, established neighborhood of North St. Louis County. The property offers a functional floor plan with comfortable living spaces and good natural light throughout. A spacious yard provides room for outdoor enjoyment, gardening, or future enhancements. Conveniently situated near shopping, dining, schools, and major roadways, this home offers easy access to everyday amenities while maintaining a residential feel. A great opportunity for buyers seeking value and potential in the Hazelwood School District area.
-
2026-01-20$104,900 Active 556-char remark
Show marketing remark (556 chars)
Welcome to this well-located home in a quiet, established neighborhood of North St. Louis County. The property offers a functional floor plan with comfortable living spaces and good natural light throughout. A spacious yard provides room for outdoor enjoyment, gardening, or future enhancements. Conveniently situated near shopping, dining, schools, and major roadways, this home offers easy access to everyday amenities while maintaining a residential feel. A great opportunity for buyers seeking value and potential in the Hazelwood School District area.
-
2021-01-14soldstatus $76,460
-
2018-04-23soldstatus $52,000
-
2014-09-11soldstatus $32,500
-
2014-04-29soldstatus $15,000
-
2010-03-30soldstatus $67,400
-
1996-09-03soldstatus
-
1996-09-03soldstatus
ⓘ Source: listings_history table (triggers on properties + properties_extension) + one-shot
backfill from property_details.listing_events for pre-trigger history.
Tax reassessment forecast MO · Resets to sale price
- Current annual tax
- $1,719 · $143/mo
- Projected year-2 tax
- $1,719 · $143/mo
- Expected delta
- $0/yr ($0/mo · 0.0%)
ⓘ Screening estimate from a state-policy table — verify with the county assessor before closing.
Climate risk First Street
- Flood 1/10 Low FEMA zone X (unshaded) · 0% chance over 30 yrs
- Wildfire 1/10 Low
- Heat 5/10 Major 7 d/yr ≥107°F today · 21 d/yr by 30 yrs out
- Wind 2/10 Low 100% chance of damaging wind over 30 yrs
- Air quality 4/10 Moderate 4 unhealthy d/yr today · 5 by 30 yrs out
Nearby sold comps map
Loading sold comps map…
Walkable amenities ~0.75 mi
Loading nearby amenities…
Taxation est. · year 1
- Rental income
- $16,986
- − Mortgage interest
- −$5,876
- − Property taxes
- −$1,719
- − Insurance
- −$524
- − Repairs & maintenance
- −$1,359
- − Management
- −$1,359
- − Depreciation
- −$3,052
- Taxable income
- $3,098
- Est. tax owed @ 24.0%
- −$743
- After-tax cash flow
- $3,831/yr
For passive investors: Depreciation is non-cash, so a rental often shows a tax loss while cash-flowing — sheltering income. Rental losses are passive: they offset passive income freely, and up to $25,000/yr can offset ordinary (W-2) income if you actively participate and your MAGI is under $100k (phasing out to $0 by $150k); unused losses carry forward. On sale, claimed depreciation is recaptured at up to 25%, and gains may owe capital-gains tax (a 1031 exchange can defer both). Figures are a year-1 estimate at your 24.0% rate — not tax advice; consult a CPA.
Schools (NCES district)
- District
- Hazelwood
- NCES district ID
- 2913830
- Math proficiency
- 11% ▼ -13.00%
- Reading proficiency
- 26% ▼ -6.00%
- Median HH income
- $51,621
- Composite
- 16.77/100
- National rank
- #9156
- State rank
- #306 of 324 in MO
Livability — Spanish Lake
- Score
- 51/100
- State rank
- #870
- US rank
- #25189
Category grades
Schools grade is shown separately in the Schools card above.
Census & demographics
- Census place
- Spanish Lake, MO
- County
- Saint Louis County · 888,823 people
- City population
- 18,233
- Metro
- St. Louis, MO-IL
- Population (ZIP)
- 18,233
- Household income
- $56,096
- Rent vs Own
- Severe rent burden
- 925.0
Population outlook (St. Louis County) Hauer SSP2
- Today (2025)
- 1,025,227 people
- By 2030
- 1,028,023 · +0.3%
- By 2040
- 1,020,940 · -0.4%
- By 2050
- 1,007,280 · -1.8%
- By 2075
- 987,277 · -3.7%
- By 2100
- 921,984 · -10.1%
Race, ethnicity, and origin ACS 2023
- Neighborhood character
- Predominantly Black (81%)
- Race & ethnicity
- Black 81% White 14% Two or more races 4% Hispanic / Latino 1%
- Foreign-born
- 2% · Canada
- Languages at home
- 98% English-only · Spanish 1%
Political lean MEDSL · St. Louis
- 2024 margin
- Strong D (+23.4) · D 60.8% · R 37.4% · Other 1.7%
- 2008→2024 swing
- +3.5pp toward D · 2008: 19.9pp · 2024: 23.4pp
- All cycles
- 2024: D+23.4 2020: D+24.0 2016: D+16.2 2012: D+13.7 2008: D+19.9
Not yet ingested
- Civics
- —
Market trends
- HPI YoY
- ▼ -74.09%
- Current HPI
- 165.2146
- Rent YoY
- ▼ -1.54%
- Metro
- St. Louis, MO-IL
- State GDP YoY
- ▲ 1.84%
- F500 in state
- 20
Industry mix (Fortune 500 HQ in MO)
| Industry | F500 HQs | Revenue |
|---|---|---|
| Healthcare | 1 | $163B |
|
||
| Insurance | 1 | $21B |
|
||
| Industrial Technology | 1 | $17B |
|
||
| Retail | 1 | $16B |
|
||
| Industrial Distribution | 1 | $10B |
|
||
| Utilities | 1 | $9B |
|
||
Price history
+55.6% since first listed14 events — show timeline
- 2026-05-19 Pending — MARIS as Distributed by MLS Grid
- 2026-05-16 Listed $104,900 MARIS as Distributed by MLS Grid
- 2026-05-16 Price Changed $104,900 MARIS as Distributed by MLS Grid
- 2026-05-16 Coming Soon $105,000 MARIS as Distributed by MLS Grid
- 2026-02-25 Sold (MLS) — MARIS as Distributed by MLS Grid
- 2026-02-02 Pending — MARIS as Distributed by MLS Grid
- 2026-01-20 Listed $104,900 MARIS as Distributed by MLS Grid
- 2021-01-14 Sold (Public Records) $76,460 Public Records
- 2018-04-23 Sold (Public Records) $52,000 Public Records
- 2014-09-11 Sold (Public Records) $32,500 Public Records
- 2014-04-29 Sold (Public Records) $15,000 Public Records
- 2010-03-30 Sold (Public Records) $67,400 Public Records
- 1996-09-03 Sold (Public Records) — Public Records
- 1996-09-03 Sold (Public Records) — Public Records
Property tax history
+0.6%/yrLatest (2022): $1,719 · +1.5% YoY. Source: county tax records.
Cash-flow waterfall
monthlySold comps — $/sqft
last 12 mo · ≤1 miLoading sold comps…