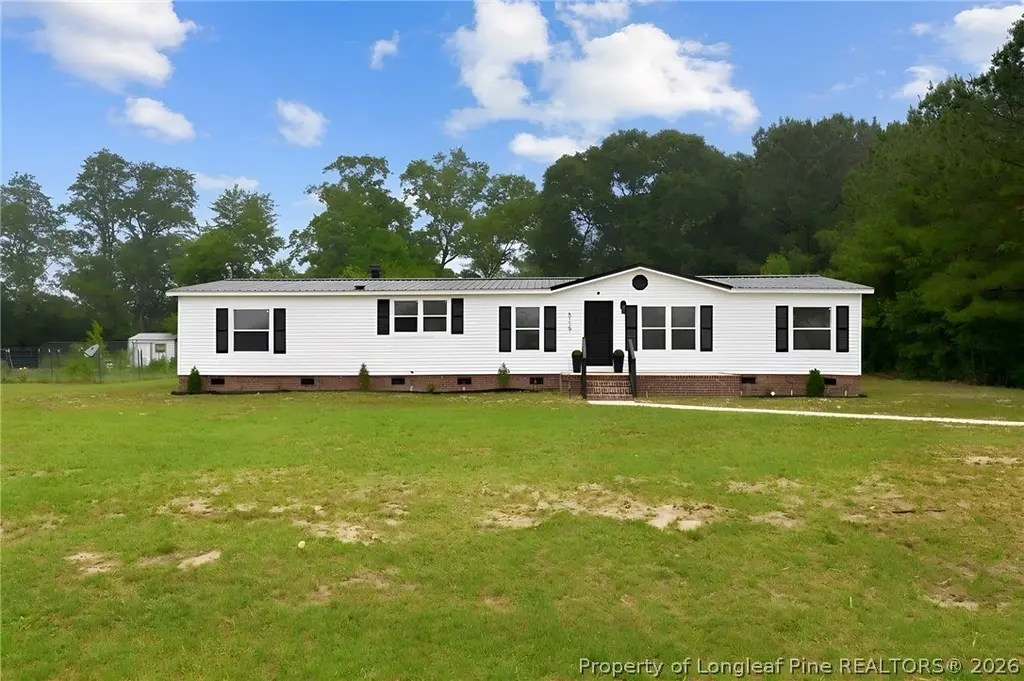
6729 Tennis Dr
Stedman, NC 28391
$219,000C
3 bd · 4.0 ba ·
1,836 sqft ·
Built 1996
· Manufactured
· Active
· 27 DOM
Cashflow @ list (25.0% down · 7.5%)
Estimated rent
$1,809/mo
Mortgage (P&I)
−$1,148
Tax + insurance
−$219
HOA
−$0
Vac / Maint / Mgmt
−$380
Net cashflow
$62/mo
Annual
$743/yr
Cap rate
6.63%
Cash-on-cash
1.21%
DSCR
1.05
1% rule
0.83%
Cash to close
$61,320
Investor read
- This is a 3-bed/4.0-bath manufactured listed at $219k.
- At list price, monthly cash flow is $62 ($743/yr) — positive.
- The deal already cash-flows at list — no discount required.
- To meet the 1% rule (rent ≥ 1% of price), the offer needs to be $181k (17.4% below list).
- It's been on market 27 days — a 2% lower offer ($216k) is reasonable based on typical stale-listing flexibility.
- Recommended offer: $181k (17.4% below list) — sets the bar for 1% rule.
- In year one you build about $23k of equity ($2k loan paydown + $22k appreciation (10.0% local appreciation)).
- Location reads 71/100 on livability (#107 in NC) — a middle-class / working-renter tenant base. Strengths: crime A+, employment A+, cost of living A+; Watch: amenities F, commute F, health & safety F.
- Cumberland County Schools (urban): math 32% / reading 41% proficiency, ranked #126 of 178 in NC (top 71%) — families likely to look elsewhere, expect single-tenant / working-renter base with shorter leases.
- Zoned schools: Mac Williams Middle (math 40% / reading 50%, grade D, #160 of 475 statewide, top 35%, 1,151 students, 58% FRL); Cape Fear High (math 75% / reading 47%, grade C+, #202 of 535 statewide, top 39%, 1,529 students, 50% FRL) — zoned schools at 54% FRL track the district average.
- Zoned-school proficiency averages 53% at this address vs 36% district-wide (+16 pts) — the actual schools serving this property are materially stronger than the Cumberland County Schools average implies; a family-tenant draw the district grade alone would hide.
- Market conditions: 33 active listings in the ZIP; 1,125 units permitted in Cumberland County in 2024 (104 in 5+ unit buildings).
- 3 sale attempts with the ask held roughly flat each time — persistent listings suggest the price (not the market) is what's stuck; bring a comps-based counter.
- At projected returns (10.0% appreciation + 3.0% rent growth), your $61k cash investment doubles in ~3 years — after that, you're playing with house money.
- By year 2, paydown + projected appreciation supports a ~$38k cash-out refi (75% LTV) — recoverable capital for the next deal without selling this one.
- Climate carrying-cost: severe wind risk, 80% chance of damaging wind over 30y; moderate wildfire risk; extreme-heat days projected 7→16/yr by 2055 (HVAC capex compounding) — expect insurance premiums to compound above CPI over the hold.
- Cap rate 6.6% vs local median 4.3% in Stedman — top-decile yield for the area; either an underpriced asset or a hidden risk that comps aren't pricing in. Stress-test before assuming the spread holds.
Questions for listing agent
- Is there a deadline driving the sale (1031 exchange, divorce, estate, relocation)? That informs how much negotiation room exists.
- What's the average days-on-market for RENTAL listings here right now (not sales)? A rising rental-DOM trend means longer vacancies and softer asking-rent achievability than the comps imply.
- What's the recent tenant-quality profile in this submarket — average credit score on applications, eviction rate, late-payment / NSF rate, and stable-employment percentage? A property-management company in the area should have these aggregated.
- How much new for-sale + rental construction is in the pipeline within 1–3 miles? Heavy new supply typically softens prices + rents 12–24 months out; constrained supply supports both.
CashFlowRE · CFR-S3C2GD26XHDK3M
· Data 2 days ago
cashflowre.app · 2026-05-29