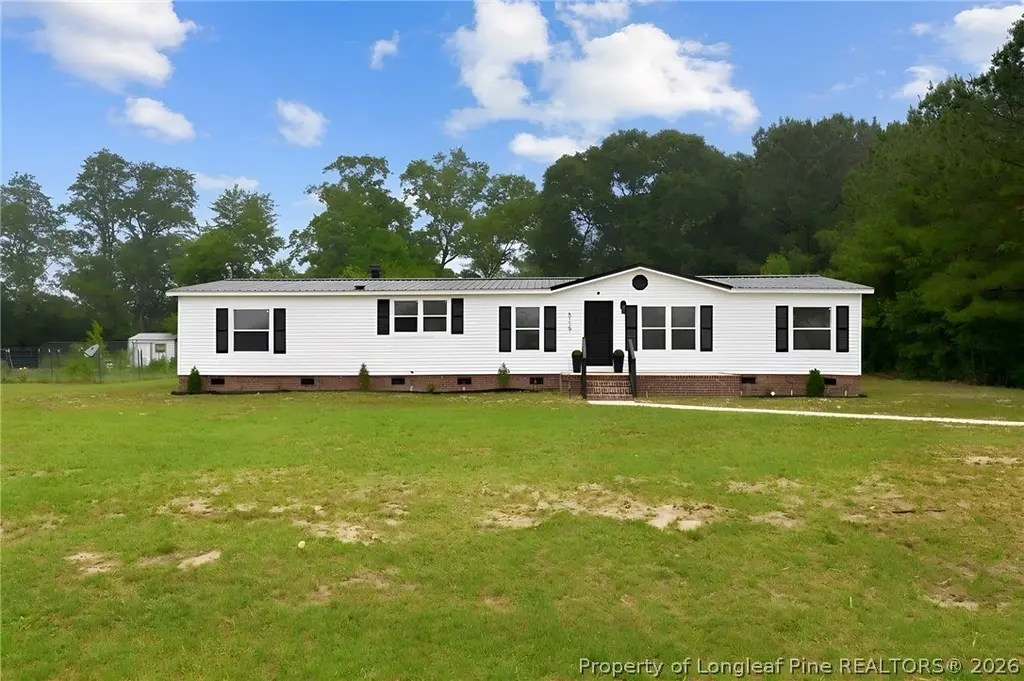
6729 Tennis Dr · Stedman, NC
Flood risk 1/10 · Minimal
- FEMA flood zone
- X (unshaded)
- Chance of flooding over 30 yrs
- 0.0%
- Est. flood insurance / yr
- $507 – $1,088
Fire risk 5/10 · Moderate
- Est. fire insurance / yr
- $906 – $1,684
Heat risk 7/10 · Major
- Hot days now (above 107°F)
- 7 days/yr
- Hot days in 30 yrs
- 16 days/yr
Wind risk 8/10 · Major
- Chance of severe wind over 30 yrs
- 80.0%
Air-quality risk 1/10 · Minimal
- Unhealthy air days now
- 0 days/yr
- Unhealthy air days in 30 yrs
- 0 days/yr
Risk factors via First Street. Map © Google.
Why this score? — see what drove the C grade
The composite is a weighted blend of 9 inputs, each scored 0–100. Each bar is that input's sub-score; the figure is the points it added to the 100-point composite (weight × sub-score).
- ARV discount +15.0/15.0
- Cash flow +14.8/30.0
- Appreciation +10.0/10.0
- DSCR +4.5/10.0
- Livability +3.6/5.0
- 1% rule +3.3/10.0
- Schools +3.1/10.0
- Rent growth +2.5/5.0
- Condition / age +2.5/5.0
$219,000
🖨 Deal sheet 📄 Offer letter ✓ Due diligence
Listing remarks
Seller offering $5,000 in concessions! Fully remodeled one-story home on a 0.63-acre end-of-the-road lot with a peaceful open outlook in Stedman. Turn-key 4 bed, 2.5 bath, 1,836 sqft with NEW wide-plank flooring, NEW doors, trim, modern lighting and fresh paint. Inviting living area features a NEW tiled fireplace with wood mantel and a sliding glass door for natural light and easy backyard flow. Kitchen shines with NEW white shaker cabinetry, butcher block counters, island seating, and Whirlpool appliances. Updated baths include a NEW porcelain-tiled walk-in shower. Big upgrades: NEW windows, NEW water heater, NEW well pump, NEW ducting, updated HVAC, plumbing, and electrical, plus a refres
Key facts
- Sliding glass door
- Stone fireplace
- 0.63-acre lot
Tags
Property features AI
Exterior
- Parking: Parking details not specified
- Security: No security features specified
- Utilities: Water from spring and well; Sewer via holding tank and septic tank
- Home design: Manufactured home; One-level layout
- Construction: Aluminum siding and brick exterior
- Exterior features: Large lot (approximately 0.63 acres); Lot dimensions approximately 140 x 200 x 141 x 200; Rural Residential zoning
Interior
- Kitchen: Dishwasher; Electric range; Microwave; Refrigerator
- Bedrooms: Bedrooms included (room level not specified)
- Flooring: Laminate flooring; Wood flooring
- Bathrooms: 2 full bathrooms; 1 half bathroom
- Heating & cooling: Central air conditioning; Ceiling fans; Electric forced-air heating
- Interior features: Ceiling fans throughout; Kitchen island; Vaulted ceilings; Walk-in closets; Wood-burning fireplace
- Laundry & utility: In-unit laundry
Neighborhood map
What this means for you Summary
Snapshot
- This is a 3-bed/4.0-bath manufactured listed at $219k.
Deal economics
- At list price, monthly cash flow is $62 ($743/yr) — positive.
- The deal already cash-flows at list — no discount required.
- To meet the 1% rule (rent ≥ 1% of price), the offer needs to be $181k (17.4% below list).
- Recommended offer: $181k (17.4% below list) — sets the bar for 1% rule.
- Cap rate 6.6% vs local median 4.3% in Stedman — top-decile yield for the area; either an underpriced asset or a hidden risk that comps aren't pricing in. Stress-test before assuming the spread holds.
Location & tenants
- Location reads 71/100 on livability (#107 in NC) — a middle-class / working-renter tenant base. Strengths: crime A+, employment A+, cost of living A+; Watch: amenities F, commute F, health & safety F.
- Cumberland County Schools (urban): math 32% / reading 41% proficiency, ranked #126 of 178 in NC (top 71%) — families likely to look elsewhere, expect single-tenant / working-renter base with shorter leases.
- Zoned schools: Mac Williams Middle (math 40% / reading 50%, grade D, #160 of 475 statewide, top 35%, 1,151 students, 58% FRL); Cape Fear High (math 75% / reading 47%, grade C+, #202 of 535 statewide, top 39%, 1,529 students, 50% FRL) — zoned schools at 54% FRL track the district average.
- Zoned-school proficiency averages 53% at this address vs 36% district-wide (+16 pts) — the actual schools serving this property are materially stronger than the Cumberland County Schools average implies; a family-tenant draw the district grade alone would hide.
- Market conditions: 33 active listings in the ZIP; 1,125 units permitted in Cumberland County in 2024 (104 in 5+ unit buildings).
Forward outlook
- In year one you build about $23k of equity ($2k loan paydown + $22k appreciation (10.0% local appreciation)).
- At projected returns (10.0% appreciation + 3.0% rent growth), your $61k cash investment doubles in ~3 years — after that, you're playing with house money.
- By year 2, paydown + projected appreciation supports a ~$38k cash-out refi (75% LTV) — recoverable capital for the next deal without selling this one.
Negotiation context
- It's been on market 27 days — a 2% lower offer ($216k) is reasonable based on typical stale-listing flexibility.
- 3 sale attempts with the ask held roughly flat each time — persistent listings suggest the price (not the market) is what's stuck; bring a comps-based counter.
Risks & watch-outs
- Climate carrying-cost: severe wind risk, 80% chance of damaging wind over 30y; moderate wildfire risk; extreme-heat days projected 7→16/yr by 2055 (HVAC capex compounding) — expect insurance premiums to compound above CPI over the hold.
Questions for the listing agent
- Is there a deadline driving the sale (1031 exchange, divorce, estate, relocation)? That informs how much negotiation room exists.
- What's the average days-on-market for RENTAL listings here right now (not sales)? A rising rental-DOM trend means longer vacancies and softer asking-rent achievability than the comps imply.
- What's the recent tenant-quality profile in this submarket — average credit score on applications, eviction rate, late-payment / NSF rate, and stable-employment percentage? A property-management company in the area should have these aggregated.
- How much new for-sale + rental construction is in the pipeline within 1–3 miles? Heavy new supply typically softens prices + rents 12–24 months out; constrained supply supports both.
Investment metrics
- 1% rule
- 0.83% ✗
- Cap rate
- 6.63%
- Cash-on-cash
- 1.21%
- DSCR
- 1.05
- GRM
- 10.1
CMA / ARV
- ARV (on-the-fly)
- $271,728
- Comps found
- 1
Show comp detail 1 sale within ~0.75 mi
| Address | Dist | Beds/Ba | Sqft | Sold | Price | $/sf | Match |
|---|---|---|---|---|---|---|---|
| 1531 Minnie Vada Ln | 0.72mi | 3/2.0 | 1,920 (+5%) | 0mo | $285,000 | $148 | 50 |
Match score weights: distance 35% · size 25% · config 20% · recency 20%. Top-matched comps best support the ARV.
Projected returns pro-forma
10.0% appreciation · 3.0% rent growth · sell at horizon
- IRR
- 25.1%
- Equity multiple
- 3.01×
- Total profit
- $123,154
- Equity at exit
- $197,293
- IRR
- 22.2%
- Equity multiple
- 6.86×
- Total profit
- $359,443
- Equity at exit
- $425,469
Cash invested: $61,320 (down + closing). Projections, not guarantees.
Landlord ↔ Tenant lean methodology
- Overall (STATE)
- 85 Strongly Landlord-Friendly
- State North Carolina
- 85 Strongly Landlord-Friendly · R+3
- County
- — inherits STATE
- City
- — inherits STATE
ZIP-level market 28391
- Home prices YoY
- 16.1%
- Active inventory
- 33
- Price-to-rent
- 10.1×
Monthly cashflow live
- Estimated rent
- $1,809 medium interval (Pro) →
- Mortgage (P&I)
- −$1,148
- Tax from tax record
- −$128 /mo · $1,532/yr
- Insurance
- −$91
- HOA
- −$0
- Vacancy / Maint / Mgmt
- −$380
- Net cashflow
- $62
Break-even live
UW: 25.0% down · 7.5% · 30yr · 1.5% tax · 5.0% vac · 8.0% maint · 8.0% mgmt
Financing live
Cash to close
- Down payment
- $54,750
- Closing costs
- $6,570
- Reserves months
- —
- Total cash needed
- —
Loan-product check · same deal, 3 products live
Conventional
25% down · 7.5% · 30yr
- Down + closing
- —
- Monthly P&I
- —
- Monthly cashflow
- —
- DSCR
- —
- Eligible?
- —
Personal DTI + credit; lowest rate.
DSCR
20% down · 8.5% · 30yr
- Down + closing
- —
- Monthly P&I
- —
- Monthly cashflow
- —
- DSCR
- —
- Eligible?
- —
No personal income docs; deal must DSCR.
Hard money
10% down · 12.0% · 12mo
- Down + closing
- —
- Monthly P&I
- —
- Monthly cashflow
- —
- DSCR
- —
- Eligible?
- —
Short-term bridge; refi at stabilization.
Listing history 22 events
-
2026-06-18days on market $219,000 Active 27 DOM
-
2026-06-17days on market $219,000 Active 26 DOM
-
2026-06-16days on market $219,000 Active 25 DOM
-
2026-06-15days on market $219,000 Active 24 DOM
-
2026-06-14days on market $219,000 Active 22 DOM
-
2026-06-13days on market $219,000 Active 21 DOM
-
2026-06-10pricedays on market $219,000 Active 19 DOM
-
2026-06-09days on market $224,000 Active 18 DOM
-
2026-06-08days on market $224,000 Active 17 DOM
-
2026-06-07days on market $224,000 Active 16 DOM
-
2026-06-03days on market $224,000 Active 12 DOM
-
2026-06-02pricedays on market $224,000 Active 11 DOM
-
2026-06-01days on market $229,000 Active 10 DOM
-
2026-05-31days on market $229,000 Active 9 DOM
-
2026-05-30days on market $229,000 Active 8 DOM
-
2026-05-22$229,000 Active
-
2026-04-17status Pending
-
2026-04-06price $219,000
-
2026-03-25price $229,000
-
2026-03-17price $239,000
-
2026-02-02$249,000 Active
-
2026-01-15$239,000 Active
ⓘ Source: listings_history table (triggers on properties + properties_extension) + one-shot
backfill from property_details.listing_events for pre-trigger history.
Tax reassessment forecast NC · Resets to sale price
- Current annual tax
- $1,532 · $128/mo
- Projected year-2 tax
- $1,796 · $150/mo
- Expected delta
- +$264/yr (+$22/mo · 17.3%)
ⓘ Screening estimate from a state-policy table — verify with the county assessor before closing.
Climate risk First Street
- Flood 1/10 Low FEMA zone X (unshaded) · 0% chance over 30 yrs
- Wildfire 5/10 Major
- Heat 7/10 Severe 7 d/yr ≥107°F today · 16 d/yr by 30 yrs out
- Wind 8/10 Severe 80% chance of damaging wind over 30 yrs
- Air quality 1/10 Low 0 unhealthy d/yr today · 0 by 30 yrs out
Nearby sold comps map
Loading sold comps map…
Walkable amenities ~0.75 mi
Loading nearby amenities…
Taxation est. · year 1
- Rental income
- $21,710
- − Mortgage interest
- −$12,267
- − Property taxes
- −$1,532
- − Insurance
- −$1,095
- − Repairs & maintenance
- −$1,737
- − Management
- −$1,737
- − Depreciation
- −$6,371
- Taxable loss
- −$3,028
- Est. tax savings @ 24.0%
- +$727
- After-tax cash flow
- $1,470/yr
For passive investors: Depreciation is non-cash, so a rental often shows a tax loss while cash-flowing — sheltering income. Rental losses are passive: they offset passive income freely, and up to $25,000/yr can offset ordinary (W-2) income if you actively participate and your MAGI is under $100k (phasing out to $0 by $150k); unused losses carry forward. On sale, claimed depreciation is recaptured at up to 25%, and gains may owe capital-gains tax (a 1031 exchange can defer both). Figures are a year-1 estimate at your 24.0% rate — not tax advice; consult a CPA.
Schools (NCES district)
- District
- Cumberland County Schools
- NCES district ID
- 3700011
- Math proficiency
- 32% ▼ -2.00%
- Reading proficiency
- 41% ▼ -1.00%
- Median HH income
- $44,168
- Composite
- 31.0/100
- National rank
- #6096
- State rank
- #126 of 178 in NC
Livability — Stedman
- Score
- 71/100
- State rank
- #107
- US rank
- #6799
Category grades
Schools grade is shown separately in the Schools card above.
Census & demographics
- Population (ZIP)
- 5,956
Population outlook (Cumberland County) Hauer SSP2
- Today (2025)
- 330,855 people
- By 2030
- 333,523 · +0.8%
- By 2040
- 335,583 · +1.4%
- By 2050
- 335,325 · +1.4%
- By 2075
- 342,853 · +3.6%
- By 2100
- 340,698 · +3.0%
Race, ethnicity, and origin ACS 2023
- Neighborhood character
- Predominantly White (77%)
- Race & ethnicity
- White 77% Black 12% Two or more races 7% Hispanic / Latino 2% Native American 2%
- Common ancestry
- Slovak 4% Serbian 2% Iranian 2%
- Foreign-born
- 2% · Canada
- Languages at home
- 98% English-only · Spanish 1%
Political lean MEDSL · Cumberland
- 2024 margin
- D (+13.4) · D 56.1% · R 42.7% · Other 1.2%
- 2008→2024 swing
- -4.3pp toward R · 2008: 17.7pp · 2024: 13.4pp
- All cycles
- 2024: D+13.4 2020: D+16.6 2016: D+16.0 2012: D+19.7 2008: D+17.7
Not yet ingested
- Civics
- —
Market trends
- HPI YoY
- ▲ 46.06%
- Current HPI
- 331.7099
- Rent YoY
- —
- Metro
- —
- State GDP YoY
- ▲ 3.28%
- F500 in state
- 26
Industry mix (Fortune 500 HQ in NC)
| Industry | F500 HQs | Revenue |
|---|---|---|
| Financial Services | 2 | $213B |
|
||
| Retail | 2 | $95B |
|
||
| Industrial Conglomerate | 1 | $38B |
|
||
| Metals / Steel | 1 | $35B |
|
||
| Utilities | 1 | $30B |
|
||
| Industrial Machinery | 1 | $19B |
|
||
Price history
-4.2% since first listed7 events — show timeline
- 2026-05-22 Listed $229,000 LPRMLS
- 2026-04-17 Pending — LPRMLS
- 2026-04-06 Price Changed $219,000 LPRMLS
- 2026-03-25 Price Changed $229,000 LPRMLS
- 2026-03-17 Price Changed $239,000 LPRMLS
- 2026-02-02 Listed $249,000 LPRMLS
- 2026-01-15 Listed $239,000 LPRMLS
Property tax history
+6.6%/yrLatest (2025): $1,532 · +79.3% YoY. Source: county tax records.
Cash-flow waterfall
monthlySold comps — $/sqft
last 12 mo · ≤1 miLoading sold comps…