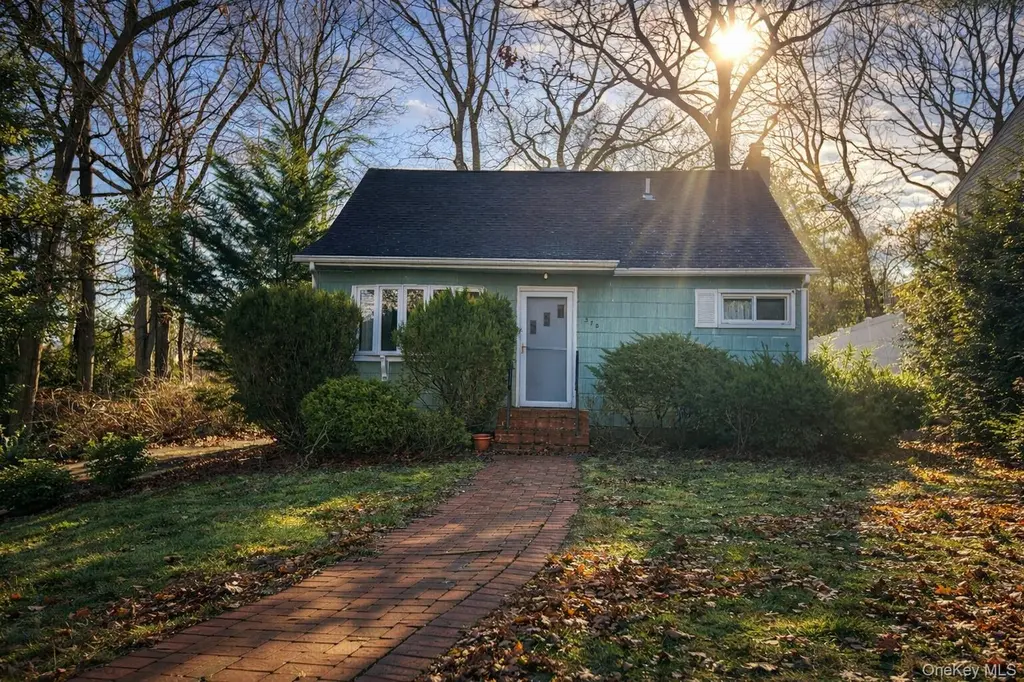
370 Boulder St
Ronkonkoma, NY 11779
$525,000D
3 bd · 2.0 ba ·
1,008 sqft ·
Built 1958
· SingleFamily
· Active
· 147 DOM
Cashflow @ list (25.0% down · 7.5%)
Estimated rent
$3,543/mo
Mortgage (P&I)
−$2,753
Tax + insurance
−$405
HOA
−$0
Vac / Maint / Mgmt
−$744
Net cashflow
$-359/mo
Annual
$-4,311/yr
Cap rate
5.47%
Cash-on-cash
-2.93%
DSCR
0.87
1% rule
0.67%
Cash to close
$147,000
Investor read
- This is a 3-bed/2.0-bath single-family listed at $525k.
- At list price, monthly cash flow is $-359 ($-4k/yr) — negative.
- To cash-flow at today's rent, offer at most $462k (12.1% below list).
- To meet the 1% rule (rent ≥ 1% of price), the offer needs to be $354k (32.5% below list).
- It's been on market 147 days — a 12% lower offer ($462k) is reasonable based on typical stale-listing flexibility.
- Recommended offer: $354k (32.5% below list) — sets the bar for 1% rule.
- Local home prices are declining (-3.0%/yr); year-one equity from $4k of loan paydown is wiped out by about $16k of value loss. Plan a longer hold.
- Location reads 73/100 on livability (#317 in NY) — a middle-class / working-renter tenant base. Strengths: employment A+, housing A+, health & safety A+; Watch: amenities F, commute F, cost of living F.
- Connetquot Central School District (suburban): math 67% / reading 63% proficiency, ranked #155 of 590 in NY (top 26%) — acceptable for families but not a draw, mixed tenant base, ~2y average lease; only 13% free/reduced lunch — higher-income household profile.
- Watch-outs: built in 1958 — expect roof / HVAC / electrical / plumbing capex.
- Market conditions: Rents flat; 173 active listings in the ZIP; 6 comparable units currently listed for rent nearby; rentals leasing fast (median 2d on market — plan ~1-2 weeks tenant-placement turnaround); high-income renter base; 1,366 units permitted in Suffolk County in 2024 (216 in 5+ unit buildings).
- Suffolk County population projected to shrink 5% by 2050 — rents likely to lag national; underwrite the cash flow, not the appreciation.
- Climate carrying-cost: major wind risk, 77% chance of damaging wind over 30y; extreme-heat days projected 7→17/yr by 2055 (HVAC capex compounding) — expect insurance premiums to compound above CPI over the hold.
- Cap rate 5.5% vs local median 3.6% in Ronkonkoma — top-decile yield for the area; either an underpriced asset or a hidden risk that comps aren't pricing in. Stress-test before assuming the spread holds.
- This rent runs 38% of the median local income ($112k/yr) — at the standard rent-burdened threshold; future hikes will face affordability resistance.
Questions for listing agent
- What do current leases actually rent for vs. the listed asking? Can we see a recent rent roll and the last 12 months of T-12 income?
- It's been on market 147 days. Have you received any prior offers? Is the seller open to a 33% concession, seller financing, or rate buy-down credit?
- Built in 1958 — when were the roof, HVAC, electrical panel, plumbing, and water heater last replaced?
- Why hasn't it sold? Are there any deal-killer items the seller is aware of (foundation, flood, title, zoning, code violations)?
- Is there a deadline driving the sale (1031 exchange, divorce, estate, relocation)? That informs how much negotiation room exists.
- Schools are B-rated — typically a magnet for longer-tenancy family renters. What's the average tenant stay here, and is there a school-zone premium baked into asking?
- The area grade is low — what's the realistic commute time and amenity access for the typical tenant pool here? Any planned neighborhood developments (good or bad) we should know about?
- What's the average days-on-market for RENTAL listings here right now (not sales)? A rising rental-DOM trend means longer vacancies and softer asking-rent achievability than the comps imply.
CashFlowRE · CFR-S3JYKB3BVD5SEF
· Data 2 days ago
cashflowre.app · 2026-05-29