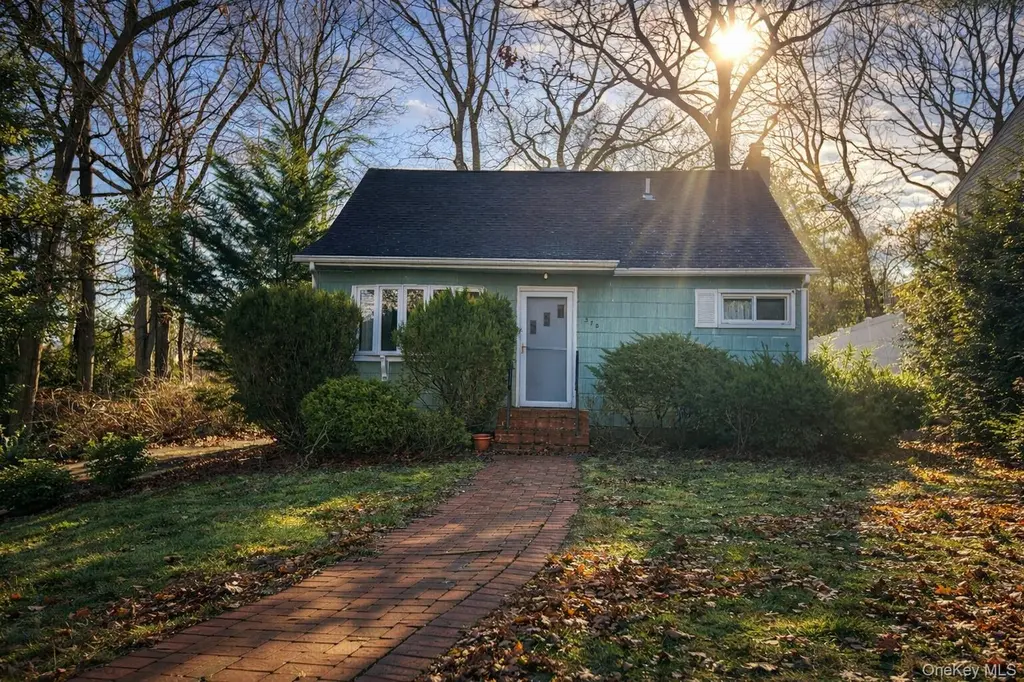
370 Boulder St · Ronkonkoma, NY
Flood risk 1/10 · Minimal
- FEMA flood zone
- X (unshaded)
- Chance of flooding over 30 yrs
- 0.0%
- Est. flood insurance / yr
- $473 – $860
Fire risk 1/10 · Minimal
- Est. fire insurance / yr
- $691 – $1,283
Heat risk 5/10 · Moderate
- Hot days now (above 93°F)
- 7 days/yr
- Hot days in 30 yrs
- 17 days/yr
Wind risk 6/10 · Moderate
- Chance of severe wind over 30 yrs
- 77.0%
Air-quality risk 4/10 · Minor
- Unhealthy air days now
- 4 days/yr
- Unhealthy air days in 30 yrs
- 6 days/yr
Risk factors via First Street. Map © Google.
Why this score? — see what drove the D grade
The composite is a weighted blend of 9 inputs, each scored 0–100. Each bar is that input's sub-score; the figure is the points it added to the 100-point composite (weight × sub-score).
- ARV discount +11.8/15.0
- Cash flow +9.6/30.0
- Schools +5.9/10.0
- Livability +3.7/5.0
- DSCR +2.7/10.0
- Rent growth +2.7/5.0
- Condition / age +2.5/5.0
- 1% rule +1.7/10.0
- Appreciation +0.0/10.0
$525,000
🖨 Deal sheet 📄 Offer letter ✓ Due diligence
Listing remarks MLS
Fixer-upper opportunity in Ronkonkoma! This 3-bedroom, 2-bath Cape offers a flexible floor plan with potential for 2 kitchens, providing versatility for a variety of household needs or future reconfiguration. Ideal for investors or a handyman buyer ready to renovate and customize. Utilities are currently off, and the property is being sold as-is. Conveniently located near major roadways, shopping, and local amenities. Buyer to verify all information, uses, permits, and certificates of occupancy.
Key facts
- 6,534 sq ft lot
- Built 1958
- Listed 147 days
Neighborhood map
What this means for you Summary
Snapshot
- This is a 3-bed/2.0-bath single-family listed at $525k.
Deal economics
- At list price, monthly cash flow is $-359 ($-4k/yr) — negative.
- To cash-flow at today's rent, offer at most $462k (12.1% below list).
- To meet the 1% rule (rent ≥ 1% of price), the offer needs to be $354k (32.5% below list).
- Recommended offer: $354k (32.5% below list) — sets the bar for 1% rule.
- Cap rate 5.5% vs local median 3.6% in Ronkonkoma — top-decile yield for the area; either an underpriced asset or a hidden risk that comps aren't pricing in. Stress-test before assuming the spread holds.
Location & tenants
- Location reads 73/100 on livability (#317 in NY) — a middle-class / working-renter tenant base. Strengths: employment A+, housing A+, health & safety A+; Watch: amenities F, commute F, cost of living F.
- Connetquot Central School District (suburban): math 67% / reading 63% proficiency, ranked #155 of 590 in NY (top 26%) — acceptable for families but not a draw, mixed tenant base, ~2y average lease; only 13% free/reduced lunch — higher-income household profile.
- Market conditions: Rents flat; 173 active listings in the ZIP; 6 comparable units currently listed for rent nearby; rentals leasing fast (median 1d on market — plan ~1-2 weeks tenant-placement turnaround); high-income renter base; 1,366 units permitted in Suffolk County in 2024 (216 in 5+ unit buildings).
- This rent runs 38% of the median local income ($112k/yr) — at the standard rent-burdened threshold; future hikes will face affordability resistance.
Forward outlook
- Local home prices are declining (-3.0%/yr); year-one equity from $4k of loan paydown is wiped out by about $16k of value loss. Plan a longer hold.
- Suffolk County population projected to shrink 5% by 2050 — rents likely to lag national; underwrite the cash flow, not the appreciation.
Negotiation context
- It's been on market 147 days — a 12% lower offer ($462k) is reasonable based on typical stale-listing flexibility.
Risks & watch-outs
- Watch-outs: built in 1958 — expect roof / HVAC / electrical / plumbing capex.
- Climate carrying-cost: major wind risk, 77% chance of damaging wind over 30y; extreme-heat days projected 7→17/yr by 2055 (HVAC capex compounding) — expect insurance premiums to compound above CPI over the hold.
Questions for the listing agent
- What do current leases actually rent for vs. the listed asking? Can we see a recent rent roll and the last 12 months of T-12 income?
- It's been on market 147 days. Have you received any prior offers? Is the seller open to a 33% concession, seller financing, or rate buy-down credit?
- Built in 1958 — when were the roof, HVAC, electrical panel, plumbing, and water heater last replaced?
- Why hasn't it sold? Are there any deal-killer items the seller is aware of (foundation, flood, title, zoning, code violations)?
- Is there a deadline driving the sale (1031 exchange, divorce, estate, relocation)? That informs how much negotiation room exists.
- Schools are B-rated — typically a magnet for longer-tenancy family renters. What's the average tenant stay here, and is there a school-zone premium baked into asking?
- The area grade is low — what's the realistic commute time and amenity access for the typical tenant pool here? Any planned neighborhood developments (good or bad) we should know about?
- What's the average days-on-market for RENTAL listings here right now (not sales)? A rising rental-DOM trend means longer vacancies and softer asking-rent achievability than the comps imply.
- What's the recent tenant-quality profile in this submarket — average credit score on applications, eviction rate, late-payment / NSF rate, and stable-employment percentage? A property-management company in the area should have these aggregated.
- How much new for-sale + rental construction is in the pipeline within 1–3 miles? Heavy new supply typically softens prices + rents 12–24 months out; constrained supply supports both.
Investment metrics
- 1% rule
- 0.67% ✗
- Cap rate
- 5.47%
- Cash-on-cash
- -2.93%
- DSCR
- 0.87
- GRM
- 12.3
CMA / ARV
- ARV (median comp)
- $580,000
- List price
- $525,000
- Delta
- -9.48%
- Verdict
- FAIR
- Comps
- 20 within 1.0 mi
Show comp detail 12 sales within ~0.75 mi
| Address | Dist | Beds/Ba | Sqft | Sold | Price | $/sf | Match |
|---|---|---|---|---|---|---|---|
| 143 Belle Ave | 0.10mi | 3/1.0 | 1,008 (0%) | 6mo | $532,000 | $528 | 86 |
| 416 Fir Grove Rd | 0.30mi | 3/1.0 | 1,008 (0%) | 4mo | $530,000 | $526 | 78 |
| 131 Belle Ave | 0.09mi | 3/2.0 | 1,110 (+10%) | 2mo | $561,450 | $506 | 77 |
| 281 Fir Grove Rd | 0.44mi | 3/2.0 | 994 (-1%) | 5mo | $580,000 | $584 | 73 |
| 374 Port Ave | 0.32mi | 3/1.0 | 1,064 (+6%) | 3mo | $580,000 | $545 | 69 |
| 80 Parkway Blvd | 0.48mi | 2/1.5 (-1) | 1,025 (+2%) | 2mo | $552,000 | $539 | 66 |
| 72 Parkway Blvd | 0.47mi | 3/1.0 | 1,050 (+4%) | 10mo | $495,000 | $471 | 59 |
| 268 Haven Ave | 0.55mi | 4/2.0 (+1) | 1,056 (+5%) | 5mo | $577,000 | $546 | 57 |
| 430 Richmond Blvd | 0.65mi | 2/2.0 (-1) | 985 (-2%) | 6mo | $470,000 | $477 | 56 |
| 236 Wildwood Rd | 0.59mi | 3/1.0 | 1,008 (0%) | 16mo | $535,000 | $531 | 55 |
| 84 Broadway | 0.51mi | 2/1.0 (-1) | 897 (-11%) | 6mo | $490,000 | $546 | 44 |
| 233 Pawnee St | 0.54mi | 2/1.0 (-1) | 900 (-11%) | 10mo | $420,000 | $467 | 40 |
Match score weights: distance 35% · size 25% · config 20% · recency 20%. Top-matched comps best support the ARV.
Projected returns pro-forma
-3.0% appreciation · 0.79% rent growth · sell at horizon
- IRR
- -23.4%
- Equity multiple
- 0.21×
- Total profit
- $-115,897
- Equity at exit
- $78,279
- IRR
- -24.3%
- Equity multiple
- -0.10×
- Total profit
- $-161,599
- Equity at exit
- $45,392
Cash invested: $147,000 (down + closing). Projections, not guarantees.
Landlord ↔ Tenant lean methodology
- Overall (STATE)
- 15 Strongly Tenant-Friendly
- State New York
- 15 Strongly Tenant-Friendly · D+10
- County
- — inherits STATE
- City
- — inherits STATE
ZIP-level market 11779
- Rents YoY
- 0.8%
- Active inventory
- 173
- Price-to-rent
- 12.3×
Monthly cashflow live
- Estimated rent
- $3,543 high interval (Pro) →
- Mortgage (P&I)
- −$2,753
- Tax from tax record
- −$186 /mo · $2,235/yr
- Insurance
- −$219
- HOA
- −$0
- Vacancy / Maint / Mgmt
- −$744
- Net cashflow
- $-359
Break-even live
UW: 25.0% down · 7.5% · 30yr · 1.5% tax · 5.0% vac · 8.0% maint · 8.0% mgmt
Financing live
Cash to close
- Down payment
- $131,250
- Closing costs
- $15,750
- Reserves months
- —
- Total cash needed
- —
Loan-product check · same deal, 3 products live
Conventional
25% down · 7.5% · 30yr
- Down + closing
- —
- Monthly P&I
- —
- Monthly cashflow
- —
- DSCR
- —
- Eligible?
- —
Personal DTI + credit; lowest rate.
DSCR
20% down · 8.5% · 30yr
- Down + closing
- —
- Monthly P&I
- —
- Monthly cashflow
- —
- DSCR
- —
- Eligible?
- —
No personal income docs; deal must DSCR.
Hard money
10% down · 12.0% · 12mo
- Down + closing
- —
- Monthly P&I
- —
- Monthly cashflow
- —
- DSCR
- —
- Eligible?
- —
Short-term bridge; refi at stabilization.
Rent comps 6 comps
| Address | Beds | Baths | Sqft | Rent | $/sqft | DOM | Units | Dist |
|---|---|---|---|---|---|---|---|---|
| 158 Mohawk St Ronkonkoma, NY | 2.0 | 1.0 | 820 | $3,400 | $4.15 | 1d | 1 | 0.73mi |
| 77 Richmond Blvd Unit 4A Ronkonkoma, NY | 2.0 | 1.0 | 937 | $2,900 | $3.09 | 43d | 1 | 0.92mi |
| 147 Lake Shore Rd Ronkonkoma, NY | 1.0–2.0 | 1.0 | 940 | $3,379 | $3.59 | 1d | 10 | 1.02mi |
| 287 Smithtown Blvd Nesconset, NY | 1.0–2.0 | 1.0–2.0 | 1097 | $3,900 | $3.56 | 1d | 1 | 1.11mi |
| 2129 Julia Goldbach Ave Ronkonkoma, NY | 2.0 | 1.0 | 800 | $2,800 | $3.50 | 1d | 1 | 1.37mi |
| 2 Hawkins Ave Lake Ronkonkoma, NY | 3.0 | 1.0–2.0 | 959 | $4,980 | $5.19 | 1d | 129 | 1.42mi |
Listing history 16 events
-
2026-06-18days on market $525,000 Active 147 DOM
-
2026-06-17days on market $525,000 Active 146 DOM
-
2026-06-16days on market $525,000 Active 145 DOM
-
2026-06-15days on market $525,000 Active 144 DOM
-
2026-06-13days on market $525,000 Active 142 DOM
-
2026-06-13days on market $525,000 Active 141 DOM
-
2026-06-09days on market $525,000 Active 138 DOM
-
2026-06-08days on market $525,000 Active 137 DOM
-
2026-06-07days on market $525,000 Active 136 DOM
-
2026-06-04days on market $525,000 Active 133 DOM
-
2026-06-03days on market $525,000 Active 132 DOM
-
2026-06-02days on market $525,000 Active 131 DOM
-
2026-06-01days on market $525,000 Active 130 DOM
-
2026-05-31days on market $525,000 Active 129 DOM
-
2026-04-17price $525,000 500-char remark
Show marketing remark (500 chars)
Fixer-upper opportunity in Ronkonkoma! This 3-bedroom, 2-bath Cape offers a flexible floor plan with potential for 2 kitchens, providing versatility for a variety of household needs or future reconfiguration. Ideal for investors or a handyman buyer ready to renovate and customize. Utilities are currently off, and the property is being sold as-is. Conveniently located near major roadways, shopping, and local amenities. Buyer to verify all information, uses, permits, and certificates of occupancy.
-
2026-01-22$560,000 Active 500-char remark
Show marketing remark (500 chars)
Fixer-upper opportunity in Ronkonkoma! This 3-bedroom, 2-bath Cape offers a flexible floor plan with potential for 2 kitchens, providing versatility for a variety of household needs or future reconfiguration. Ideal for investors or a handyman buyer ready to renovate and customize. Utilities are currently off, and the property is being sold as-is. Conveniently located near major roadways, shopping, and local amenities. Buyer to verify all information, uses, permits, and certificates of occupancy.
ⓘ Source: listings_history table (triggers on properties + properties_extension) + one-shot
backfill from property_details.listing_events for pre-trigger history.
Tax reassessment forecast NY · Partial reset (capped growth)
- Current annual tax
- $2,235 · $186/mo
- Projected year-2 tax
- $5,554 · $463/mo
- Expected delta
- +$3,319/yr (+$277/mo · 148.5%)
ⓘ Screening estimate from a state-policy table — verify with the county assessor before closing.
Climate risk First Street
- Flood 1/10 Low FEMA zone X (unshaded) · 0% chance over 30 yrs
- Wildfire 1/10 Low
- Heat 5/10 Major 7 d/yr ≥93°F today · 17 d/yr by 30 yrs out
- Wind 6/10 Major 77% chance of damaging wind over 30 yrs
- Air quality 4/10 Moderate 4 unhealthy d/yr today · 6 by 30 yrs out
Nearby sold comps map
Loading sold comps map…
Walkable amenities ~0.75 mi
Loading nearby amenities…
Taxation est. · year 1
- Rental income
- $42,516
- − Mortgage interest
- −$29,408
- − Property taxes
- −$2,235
- − Insurance
- −$2,625
- − Repairs & maintenance
- −$3,401
- − Management
- −$3,401
- − Depreciation
- −$15,273
- Taxable loss
- −$13,828
- Est. tax savings @ 24.0%
- +$3,319
- After-tax cash flow
- $-992/yr
For passive investors: Depreciation is non-cash, so a rental often shows a tax loss while cash-flowing — sheltering income. Rental losses are passive: they offset passive income freely, and up to $25,000/yr can offset ordinary (W-2) income if you actively participate and your MAGI is under $100k (phasing out to $0 by $150k); unused losses carry forward. On sale, claimed depreciation is recaptured at up to 25%, and gains may owe capital-gains tax (a 1031 exchange can defer both). Figures are a year-1 estimate at your 24.0% rate — not tax advice; consult a CPA.
Schools (NCES district)
- District
- Connetquot Central School District
- NCES district ID
- 3608160
- Math proficiency
- 67% ▼ -9.00%
- Reading proficiency
- 63% ▼ -6.00%
- Median HH income
- $88,180
- Composite
- 58.89/100
- National rank
- #970
- State rank
- #155 of 590 in NY
Livability — Ronkonkoma
- Score
- 73/100
- State rank
- #317
- US rank
- #5262
Category grades
Schools grade is shown separately in the Schools card above.
Census & demographics
- Census place
- Ronkonkoma, NY
- County
- Suffolk County · 679,920 people
- City population
- 38,206
- Metro
- New York-Newark-Jersey City, NY-NJ-PA
- Population (ZIP)
- 38,206
- Household income
- $112,180
- Rent vs Own
- Severe rent burden
- 874.0
Population outlook (Suffolk County) Hauer SSP2
- Today (2025)
- 1,505,262 people
- By 2030
- 1,498,318 · -0.5%
- By 2040
- 1,471,101 · -2.3%
- By 2050
- 1,424,848 · -5.3%
- By 2075
- 1,337,157 · -11.2%
- By 2100
- 1,217,720 · -19.1%
Race, ethnicity, and origin ACS 2023
- Neighborhood character
- Predominantly White (67%)
- Race & ethnicity
- White 67% Hispanic / Latino 19% Two or more races 9% Asian 7% Black 5%
- Hispanic origin (detail)
- Puerto Rican 7% Dominican 1%
- Common ancestry
- Romanian 4% Scotch-Irish 1% Lithuanian 1%
- Foreign-born
- 14% · Canada, Jamaica, China
- Languages at home
- 79% English-only · Spanish 10% Other Indo-European 7% Other Asian/Pacific 1%
Political lean MEDSL · Suffolk
- 2024 margin
- Lean R (+10.0) · D 45.0% · R 55.0%
- 2008→2024 swing
- -16.0pp toward R · 2008: 6.0pp · 2024: -10.0pp
- All cycles
- 2024: R+10.0 2020: R+0.0 2016: R+8.2 2012: D+2.9 2008: D+6.0
Not yet ingested
- Civics
- —
Market trends
- HPI YoY
- ▼ -569.98%
- Current HPI
- 350.0973
- Rent YoY
- ▲ 0.79%
- Metro
- New York-Newark-Jersey City, NY-NJ-PA
- State GDP YoY
- ▲ 2.60%
- F500 in state
- 92
Industry mix (Fortune 500 HQ in NY)
| Industry | F500 HQs | Revenue |
|---|---|---|
| Financial Services | 10 | $950B |
|
||
| Consumer Goods | 9 | $162B |
|
||
| Insurance | 4 | $225B |
|
||
| Telecommunications | 2 | $144B |
|
||
| Pharmaceuticals | 2 | $112B |
|
||
| Media / Entertainment | 2 | $69B |
|
||
Price history
-6.2% since first listed2 events — show timeline
- 2026-04-17 Price Changed $525,000 OneKey® MLS as Distributed by MLS Grid
- 2026-01-22 Listed $560,000 OneKey® MLS as Distributed by MLS Grid
Property tax history
+1.7%/yrLatest (2017): $2,235 · +0.1% YoY. Source: county tax records.
Cash-flow waterfall
monthlySold comps — $/sqft
last 12 mo · ≤1 miLoading sold comps…