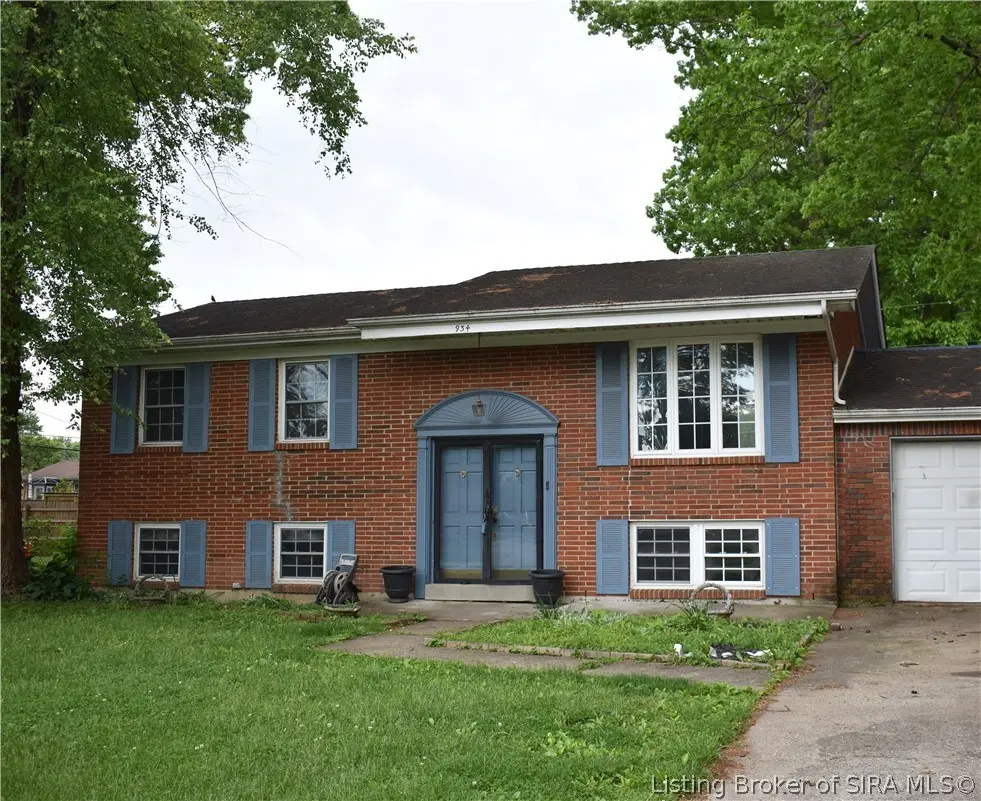
934 Parkwood Dr
Clarksville, IN 47129
$200,000D+
3 bd · 1.5 ba ·
2,028 sqft ·
Built 1969
· SingleFamily
· Active
· 38 DOM
Cashflow @ list (25.0% down · 7.5%)
Estimated rent
$1,695/mo
Mortgage (P&I)
−$1,049
Tax + insurance
−$273
HOA
−$0
Vac / Maint / Mgmt
−$356
Net cashflow
$17/mo
Annual
$205/yr
Cap rate
6.40%
Cash-on-cash
0.37%
DSCR
1.02
1% rule
0.85%
Cash to close
$56,000
Investor read
- This is a 3-bed/1.5-bath single-family listed at $200k.
- At list price, monthly cash flow is $17 ($205/yr) — positive.
- The deal already cash-flows at list — no discount required.
- To meet the 1% rule (rent ≥ 1% of price), the offer needs to be $169k (15.3% below list).
- It's been on market 38 days — a 3% lower offer ($194k) is reasonable based on typical stale-listing flexibility.
- Recommended offer: $169k (15.3% below list) — sets the bar for 1% rule.
- Local home prices are declining (-3.0%/yr); year-one equity from $1k of loan paydown is wiped out by about $6k of value loss. Plan a longer hold.
- Location reads 76/100 on livability (#46 in IN, #3,300 nationally) — a middle-class / working-renter tenant base. Strengths: cost of living A+, housing A+, commute A-; Watch: crime D+, employment D+, amenities D.
- Greater Clark County Schools (suburban): math 26% / reading 37% proficiency, ranked #224 of 301 in IN (top 74%) — families likely to look elsewhere, expect single-tenant / working-renter base with shorter leases.
- Market conditions: 29 active listings in the ZIP; 6 comparable units currently listed for rent nearby; rentals lingering (median 44d on market — plan ~5-8 weeks vacancy on turnover, expect pricing pressure); 50% of comp listings sitting > 30 days — soft ceiling on asking rent; 911 units permitted in Clark County in 2024 (133 in 5+ unit buildings).
- Clark County population projected at +17% by 2050 — long-run rental-demand tailwind backs the buy-and-hold thesis.
- Climate carrying-cost: extreme-heat days projected 7→20/yr by 2055 (HVAC capex compounding) — expect insurance premiums to compound above CPI over the hold.
- Cap rate 6.4% vs local median 3.5% in Clarksville — top-decile yield for the area; either an underpriced asset or a hidden risk that comps aren't pricing in. Stress-test before assuming the spread holds.
- This rent runs 36% of the median local income ($56k/yr) — at the standard rent-burdened threshold; future hikes will face affordability resistance.
Questions for listing agent
- It's been on market 38 days. Have you received any prior offers? Is the seller open to a 15% concession, seller financing, or rate buy-down credit?
- Built in 1969 — when were the roof, HVAC, electrical panel, plumbing, and water heater last replaced?
- Is there a deadline driving the sale (1031 exchange, divorce, estate, relocation)? That informs how much negotiation room exists.
- Schools are D-rated, which usually means shorter tenancies and higher turnover. Who's the typical renter profile here, and what's been the actual vacancy rate?
- Crime grade is D in this area — have there been break-ins, vandalism, or insurance claims at this property in the last 3 years? What carrier currently insures it and at what premium?
- The area grade is low — what's the realistic commute time and amenity access for the typical tenant pool here? Any planned neighborhood developments (good or bad) we should know about?
- What's the average days-on-market for RENTAL listings here right now (not sales)? A rising rental-DOM trend means longer vacancies and softer asking-rent achievability than the comps imply.
- What's the recent tenant-quality profile in this submarket — average credit score on applications, eviction rate, late-payment / NSF rate, and stable-employment percentage? A property-management company in the area should have these aggregated.
CashFlowRE · CFR-S5P4EDAFTYNQVV
· Data 2 days ago
cashflowre.app · 2026-05-29