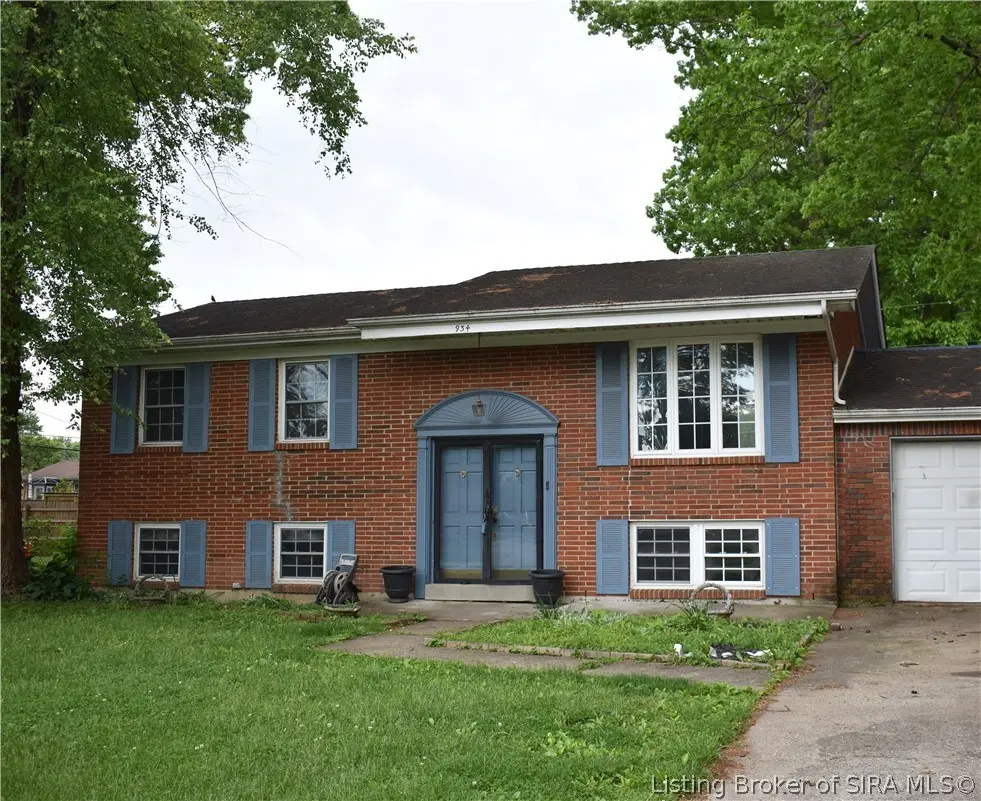
934 Parkwood Dr · Clarksville, IN
Flood risk 1/10 · Minimal
- FEMA flood zone
- X (unshaded)
- Chance of flooding over 30 yrs
- 0.0%
- Est. flood insurance / yr
- $507 – $1,088
Fire risk 1/10 · Minimal
- Est. fire insurance / yr
- $717 – $1,331
Heat risk 5/10 · Moderate
- Hot days now (above 106°F)
- 7 days/yr
- Hot days in 30 yrs
- 20 days/yr
Wind risk 2/10 · Minimal
- Chance of severe wind over 30 yrs
- 2.0%
Air-quality risk 2/10 · Minimal
- Unhealthy air days now
- 1 days/yr
- Unhealthy air days in 30 yrs
- 2 days/yr
Risk factors via First Street. Map © Google.
Why this score? — see what drove the D+ grade
The composite is a weighted blend of 9 inputs, each scored 0–100. Each bar is that input's sub-score; the figure is the points it added to the 100-point composite (weight × sub-score).
- ARV discount +15.0/15.0
- Cash flow +13.8/30.0
- DSCR +4.2/10.0
- Livability +3.8/5.0
- 1% rule +3.5/10.0
- Schools +2.7/10.0
- Rent growth +2.5/5.0
- Condition / age +2.5/5.0
- Appreciation +0.0/10.0
$200,000
🖨 Deal sheet 📄 Offer letter ✓ Due diligence
Listing remarks
Don't miss your opportunity to turn this gem into a diamond! Perfect for investors or buyers looking to add their personal touch, this spacious bi-level home offers a fantastic layout and endless potential. Situated on a nice lot, the property features abundant living space across two levels and is ready for your updates and vision. Whether you're dreaming of creating your ideal home or adding a solid income-producing property to your portfolio, this one is worth a look. Offering 4 bedrooms, 1.5 baths, a spacious two-car garage with workbench area, and a large concrete driveway, there?s plenty of room both inside and out. Enjoy the backyard space, deck off the kitchen, and walk-out basement
Key facts
- Deck off the kitchen
- Walk-out basement
- Backyard space
Tags
Property features AI
Exterior
- Parking: Attached 2-car garage
- Utilities: Public water; Public sewer
- Home design: Residential property; Resale condition
- Construction: Block foundation
- Exterior features: Deck; Patio; Paved driveway; Sidewalks
Interior
- Bedrooms: Bedroom on first level (10 x 9)
- Bathrooms: 1 full bathroom; 1 half bathroom
- Heating & cooling: Forced-air heating; Central air conditioning
- Interior features: Attic; Ceiling fans; Main-level primary bedroom; Walk-out finished basement; Gas fireplace in family room
- Laundry & utility: Laundry in basement
Neighborhood map
What this means for you Summary
Snapshot
- This is a 3-bed/1.5-bath single-family listed at $200k.
Deal economics
- At list price, monthly cash flow is $17 ($205/yr) — positive.
- The deal already cash-flows at list — no discount required.
- To meet the 1% rule (rent ≥ 1% of price), the offer needs to be $169k (15.3% below list).
- Recommended offer: $169k (15.3% below list) — sets the bar for 1% rule.
- Cap rate 6.4% vs local median 3.5% in Clarksville — top-decile yield for the area; either an underpriced asset or a hidden risk that comps aren't pricing in. Stress-test before assuming the spread holds.
Location & tenants
- Location reads 76/100 on livability (#46 in IN, #3,300 nationally) — a middle-class / working-renter tenant base. Strengths: cost of living A+, housing A+, commute A-; Watch: crime D+, employment D+, amenities D.
- Greater Clark County Schools (suburban): math 26% / reading 37% proficiency, ranked #224 of 301 in IN (top 74%) — families likely to look elsewhere, expect single-tenant / working-renter base with shorter leases.
- Market conditions: 29 active listings in the ZIP; 6 comparable units currently listed for rent nearby; rentals lingering (median 44d on market — plan ~5-8 weeks vacancy on turnover, expect pricing pressure); 50% of comp listings sitting > 30 days — soft ceiling on asking rent; 911 units permitted in Clark County in 2024 (133 in 5+ unit buildings).
- This rent runs 36% of the median local income ($56k/yr) — at the standard rent-burdened threshold; future hikes will face affordability resistance.
Forward outlook
- Local home prices are declining (-3.0%/yr); year-one equity from $1k of loan paydown is wiped out by about $6k of value loss. Plan a longer hold.
- Clark County population projected at +17% by 2050 — long-run rental-demand tailwind backs the buy-and-hold thesis.
Negotiation context
- It's been on market 38 days — a 3% lower offer ($194k) is reasonable based on typical stale-listing flexibility.
Risks & watch-outs
- Climate carrying-cost: extreme-heat days projected 7→20/yr by 2055 (HVAC capex compounding) — expect insurance premiums to compound above CPI over the hold.
Questions for the listing agent
- It's been on market 38 days. Have you received any prior offers? Is the seller open to a 15% concession, seller financing, or rate buy-down credit?
- Built in 1969 — when were the roof, HVAC, electrical panel, plumbing, and water heater last replaced?
- Is there a deadline driving the sale (1031 exchange, divorce, estate, relocation)? That informs how much negotiation room exists.
- Schools are D-rated, which usually means shorter tenancies and higher turnover. Who's the typical renter profile here, and what's been the actual vacancy rate?
- Crime grade is D in this area — have there been break-ins, vandalism, or insurance claims at this property in the last 3 years? What carrier currently insures it and at what premium?
- The area grade is low — what's the realistic commute time and amenity access for the typical tenant pool here? Any planned neighborhood developments (good or bad) we should know about?
- What's the average days-on-market for RENTAL listings here right now (not sales)? A rising rental-DOM trend means longer vacancies and softer asking-rent achievability than the comps imply.
- What's the recent tenant-quality profile in this submarket — average credit score on applications, eviction rate, late-payment / NSF rate, and stable-employment percentage? A property-management company in the area should have these aggregated.
- How much new for-sale + rental construction is in the pipeline within 1–3 miles? Heavy new supply typically softens prices + rents 12–24 months out; constrained supply supports both.
Investment metrics
- 1% rule
- 0.85% ✗
- Cap rate
- 6.40%
- Cash-on-cash
- 0.37%
- DSCR
- 1.02
- GRM
- 9.8
CMA / ARV
- ARV (median comp)
- $248,996
- List price
- $200,000
- Delta
- -19.68%
- Verdict
- UNDERPRICED
- Comps
- 20 within 1.0 mi
Show comp detail 12 sales within ~0.75 mi
| Address | Dist | Beds/Ba | Sqft | Sold | Price | $/sf | Match |
|---|---|---|---|---|---|---|---|
| 2308 Brookwood Ct | 0.27mi | 3/2.0 | 1,998 (-2%) | 2mo | $282,000 | $141 | 82 |
| 908 Hazelwood Park | 0.16mi | 3/2.0 | 1,931 (-5%) | 8mo | $285,000 | $148 | 76 |
| 2221 Buckeye Dr | 0.30mi | 3/3.0 | 2,020 (-0%) | 6mo | $243,000 | $120 | 74 |
| 701 Parkwood Dr | 0.31mi | 3/1.5 | 1,961 (-3%) | 10mo | $245,000 | $125 | 72 |
| 1028 Spicewood Plz | 0.23mi | 4/1.5 (+1) | 2,150 (+6%) | 6mo | $200,000 | $93 | 70 |
| 924 Spicewood Dr | 0.17mi | 4/2.0 (+1) | 1,902 (-6%) | 9mo | $265,000 | $139 | 67 |
| 2407 Raintree Dr | 0.19mi | 4/2.0 (+1) | 2,142 (+6%) | 10mo | $275,000 | $128 | 67 |
| 2334 Lombardy Dr | 0.17mi | 3/2.0 | 2,319 (+14%) | 7mo | $235,000 | $101 | 61 |
| 1004 Hazelwood Dr | 0.21mi | 4/1.0 (+1) | 1,724 (-15%) | 10mo | $219,900 | $128 | 50 |
| 1722 Whittier Dr | 0.69mi | 3/1.0 | 1,800 (-11%) | 9mo | $200,000 | $111 | 40 |
| 1225 Longfellow Dr | 0.70mi | 4/2.0 (+1) | 2,262 (+12%) | 2mo | $269,900 | $119 | 39 |
| 1232 Longfellow Dr | 0.70mi | 3/2.0 | 1,850 (-9%) | 15mo | $211,000 | $114 | 38 |
Match score weights: distance 35% · size 25% · config 20% · recency 20%. Top-matched comps best support the ARV.
Projected returns pro-forma
-3.0% appreciation · 3.0% rent growth · sell at horizon
- IRR
- -15.7%
- Equity multiple
- 0.44×
- Total profit
- $-31,333
- Equity at exit
- $29,821
- IRR
- -7.3%
- Equity multiple
- 0.54×
- Total profit
- $-25,932
- Equity at exit
- $17,292
Cash invested: $56,000 (down + closing). Projections, not guarantees.
Landlord ↔ Tenant lean methodology
- Overall (STATE)
- 90 Strongly Landlord-Friendly
- State Indiana
- 90 Strongly Landlord-Friendly · R+11
- County
- — inherits STATE
- City
- — inherits STATE
ZIP-level market 47129
- Home prices YoY
- -30.9%
- Active inventory
- 29
- Price-to-rent
- 9.8×
Monthly cashflow live
- Estimated rent
- $1,695 high interval (Pro) →
- Mortgage (P&I)
- −$1,049
- Tax from tax record
- −$190 /mo · $2,276/yr
- Insurance
- −$83
- HOA
- −$0
- Vacancy / Maint / Mgmt
- −$356
- Net cashflow
- $17
Break-even live
UW: 25.0% down · 7.5% · 30yr · 1.5% tax · 5.0% vac · 8.0% maint · 8.0% mgmt
Financing live
Cash to close
- Down payment
- $50,000
- Closing costs
- $6,000
- Reserves months
- —
- Total cash needed
- —
Loan-product check · same deal, 3 products live
Conventional
25% down · 7.5% · 30yr
- Down + closing
- —
- Monthly P&I
- —
- Monthly cashflow
- —
- DSCR
- —
- Eligible?
- —
Personal DTI + credit; lowest rate.
DSCR
20% down · 8.5% · 30yr
- Down + closing
- —
- Monthly P&I
- —
- Monthly cashflow
- —
- DSCR
- —
- Eligible?
- —
No personal income docs; deal must DSCR.
Hard money
10% down · 12.0% · 12mo
- Down + closing
- —
- Monthly P&I
- —
- Monthly cashflow
- —
- DSCR
- —
- Eligible?
- —
Short-term bridge; refi at stabilization.
Rent comps 6 comps
| Address | Beds | Baths | Sqft | Rent | $/sqft | DOM | Units | Dist |
|---|---|---|---|---|---|---|---|---|
| 2022 Greentree N Unit 1 Clarksville, IN | 3.0 | 2.5 | 1635 | $2,110 | $1.29 | 43d | 1 | 0.32mi |
| 1201 Marlowe Dr Clarksville, IN | 1.0–3.0 | 1.0–1.5 | 1127 | $1,409 | $1.25 | 1d | 1 | 0.68mi |
| 2408 Blackiston Mill Rd Clarksville, IN | 4.0 | 1.0 | 1456 | $1,649 | $1.13 | 43d | 1 | 0.73mi |
| 2102 Bradford St Unit 94B Clarksville, IN | 3.0 | 2.0 | 1568 | $1,259 | $0.80 | 3d | 1 | 0.84mi |
| 1534 Blackiston Mill Rd Unit 2 Clarksville, IN | 3.0 | 1.0 | 1500 | $1,650 | $1.10 | 43d | 1 | 1.02mi |
| 4501 Town Center Blvd Jeffersonville, IN | 1.0–3.0 | 1.0–2.0 | 1172 | $1,930 | $1.65 | 1d | 62 | 1.33mi |
Listing history 15 events
-
2026-06-18days on market $200,000 Active 38 DOM
-
2026-06-17days on market $200,000 Active 37 DOM
-
2026-06-16days on market $200,000 Active 36 DOM
-
2026-06-15days on market $200,000 Active 35 DOM
-
2026-06-13days on market $200,000 Active 33 DOM
-
2026-06-13days on market $200,000 Active 32 DOM
-
2026-06-10days on market $200,000 Active 30 DOM
-
2026-06-09days on market $200,000 Active 29 DOM
-
2026-06-08days on market $200,000 Active 28 DOM
-
2026-06-07days on market $200,000 Active 27 DOM
-
2026-06-03days on market $200,000 Active 23 DOM
-
2026-06-02days on market $200,000 Active 22 DOM
-
2026-06-01days on market $200,000 Active 21 DOM
-
2026-05-31days on market $200,000 Active 20 DOM
-
2026-05-11$200,000 Active 1015-char remark
ⓘ Source: listings_history table (triggers on properties + properties_extension) + one-shot
backfill from property_details.listing_events for pre-trigger history.
Tax reassessment forecast IN · Partial reset (capped growth)
- Current annual tax
- $2,276 · $190/mo
- Projected year-2 tax
- $2,276 · $190/mo
- Expected delta
- $0/yr ($0/mo · 0.0%)
ⓘ Screening estimate from a state-policy table — verify with the county assessor before closing.
Climate risk First Street
- Flood 1/10 Low FEMA zone X (unshaded) · 0% chance over 30 yrs
- Wildfire 1/10 Low
- Heat 5/10 Major 7 d/yr ≥106°F today · 20 d/yr by 30 yrs out
- Wind 2/10 Low 2% chance of damaging wind over 30 yrs
- Air quality 2/10 Low 1 unhealthy d/yr today · 2 by 30 yrs out
Nearby sold comps map
Loading sold comps map…
Walkable amenities ~0.75 mi
Loading nearby amenities…
Taxation est. · year 1
- Rental income
- $20,337
- − Mortgage interest
- −$11,203
- − Property taxes
- −$2,276
- − Insurance
- −$1,000
- − Repairs & maintenance
- −$1,627
- − Management
- −$1,627
- − Depreciation
- −$5,818
- Taxable loss
- −$3,214
- Est. tax savings @ 24.0%
- +$771
- After-tax cash flow
- $976/yr
For passive investors: Depreciation is non-cash, so a rental often shows a tax loss while cash-flowing — sheltering income. Rental losses are passive: they offset passive income freely, and up to $25,000/yr can offset ordinary (W-2) income if you actively participate and your MAGI is under $100k (phasing out to $0 by $150k); unused losses carry forward. On sale, claimed depreciation is recaptured at up to 25%, and gains may owe capital-gains tax (a 1031 exchange can defer both). Figures are a year-1 estimate at your 24.0% rate — not tax advice; consult a CPA.
Schools (NCES district)
- District
- Greater Clark County Schools
- NCES district ID
- 1803940
- Math proficiency
- 26% ▼ -15.00%
- Reading proficiency
- 37% ▼ -13.00%
- Median HH income
- $47,838
- Composite
- 27.2/100
- National rank
- #7020
- State rank
- #224 of 301 in IN
Livability — Clarksville
- Score
- 76/100
- State rank
- #46
- US rank
- #3300
Category grades
Schools grade is shown separately in the Schools card above.
Census & demographics
- Census place
- Clarksville, IN
- County
- Clark County · 108,879 people
- City population
- 19,582
- Metro
- Louisville/Jefferson County, KY-IN
- Population (ZIP)
- 19,582
- Household income
- $56,185
- Rent vs Own
- Severe rent burden
- 774.0
Population outlook (Clark County) Hauer SSP2
- Today (2025)
- 126,401 people
- By 2030
- 131,455 · +4.0%
- By 2040
- 140,471 · +11.1%
- By 2050
- 147,677 · +16.8%
- By 2075
- 161,702 · +27.9%
- By 2100
- 164,078 · +29.8%
Race, ethnicity, and origin ACS 2023
- Neighborhood character
- Predominantly White (70%)
- Race & ethnicity
- White 70% Hispanic / Latino 18% Black 8% Two or more races 7% Native American 2%
- Hispanic origin (detail)
- Mexican 15% Puerto Rican 2%
- Common ancestry
- Lithuanian 2% Slovak 2% Romanian 1%
- Foreign-born
- 10% · Canada
- Languages at home
- 84% English-only · Spanish 15%
Political lean MEDSL · Clark
- 2024 margin
- Strong R (+20.4) · D 38.9% · R 59.3% · Other 1.8%
- 2008→2024 swing
- -13.3pp toward R · 2008: -7.1pp · 2024: -20.4pp
- All cycles
- 2024: R+20.4 2020: R+18.3 2016: R+22.0 2012: R+9.9 2008: R+7.1
Not yet ingested
- Civics
- —
Market trends
- HPI YoY
- ▼ -104.33%
- Current HPI
- 233.0094
- Rent YoY
- —
- Metro
- Louisville/Jefferson County, KY-IN
- State GDP YoY
- ▲ 2.90%
- F500 in state
- 18
Industry mix (Fortune 500 HQ in IN)
| Industry | F500 HQs | Revenue |
|---|---|---|
| Industrial Machinery | 2 | $37B |
|
||
| Healthcare | 1 | $177B |
|
||
| Pharmaceuticals | 1 | $45B |
|
||
| Metals / Steel | 1 | $18B |
|
||
| Agriculture | 1 | $17B |
|
||
| Packaging | 1 | $12B |
|
||
Price history
1 event — show timeline
- 2026-05-11 Listed $200,000 SIRA
Property tax history
+7.1%/yrLatest (2024): $2,276 · +2.7% YoY. Source: county tax records.
Cash-flow waterfall
monthlySold comps — $/sqft
last 12 mo · ≤1 miLoading sold comps…