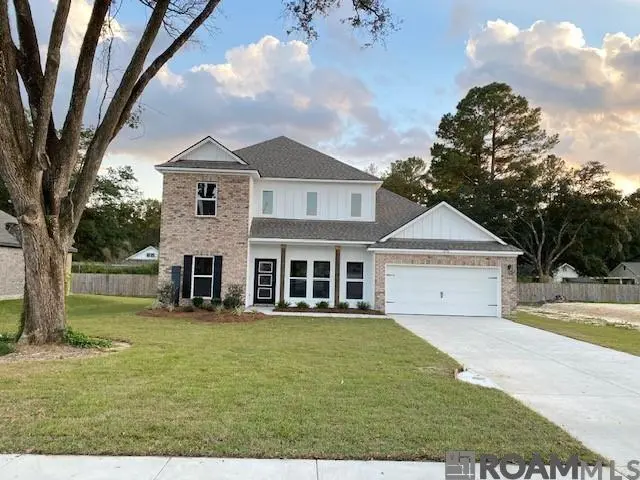
12736 Legacy Oaks Ave
Central, LA 70818
$413,900F
4 bd · 2.5 ba ·
2,661 sqft ·
Built 2025
· Land
· Active
· 298 DOM
Cashflow @ list (25.0% down · 7.5%)
Estimated rent
$2,281/mo
Mortgage (P&I)
−$2,171
Tax + insurance
−$260
HOA
−$58
Vac / Maint / Mgmt
−$479
Net cashflow
$-687/mo
Annual
$-8,246/yr
Cap rate
4.30%
Cash-on-cash
-7.12%
DSCR
0.68
1% rule
0.55%
Cash to close
$115,892
Investor read
- This is a 4-bed/2.5-bath land listed at $414k.
- At list price, monthly cash flow is $-687 ($-8k/yr) — negative.
- To cash-flow at today's rent, offer at most $293k (29.3% below list).
- To meet the 1% rule (rent ≥ 1% of price), the offer needs to be $228k (44.9% below list).
- It's been on market 298 days — a 12% lower offer ($364k) is reasonable based on typical stale-listing flexibility.
- Recommended offer: $228k (44.9% below list) — sets the bar for 1% rule.
- Local home prices are declining (-3.0%/yr); year-one equity from $3k of loan paydown is wiped out by about $12k of value loss. Plan a longer hold.
- Location reads 74/100 on livability (#25 in LA, #4,761 nationally) — a middle-class / working-renter tenant base. Strengths: employment A+, housing A+, crime B; Watch: amenities F, commute F.
- Central Community School District (suburban): math 50% / reading 54% proficiency, ranked #9 of 98 in LA (top 9%) — acceptable for families but not a draw, mixed tenant base, ~2y average lease.
- Zoned schools: Central Middle School (math 48% / reading 46%, grade D+, #37 of 218 statewide, top 18%, 1,163 students, 53% FRL); Central High School (math 45% / reading 53%, grade D, #40 of 265 statewide, top 15%, 1,587 students, 47% FRL).
- Market conditions: 129 active listings in the ZIP; 1 comparable units currently listed for rent nearby; solid renter incomes; 2,252 units permitted in East Baton Rouge Parish in 2024 (440 in 5+ unit buildings).
- East Baton Rouge County population projected at +4% by 2050 — modest demand growth; plan on rents tracking national, not racing it.
- 5 sale attempts with the ask held roughly flat each time — persistent listings suggest the price (not the market) is what's stuck; bring a comps-based counter.
- Cap rate 4.3% vs local median 3.3% in Central — meaningfully above typical; check what's discounted (condition, days-on-market, listing class) to confirm the premium yield is real.
- This rent runs 35% of the median local income ($78k/yr) — at the standard rent-burdened threshold; future hikes will face affordability resistance.
Questions for listing agent
- What do current leases actually rent for vs. the listed asking? Can we see a recent rent roll and the last 12 months of T-12 income?
- It's been on market 298 days. Have you received any prior offers? Is the seller open to a 45% concession, seller financing, or rate buy-down credit?
- What does the HOA fee cover, when was the last increase, and are there any pending special assessments or reserve-fund shortfalls?
- Why hasn't it sold? Are there any deal-killer items the seller is aware of (foundation, flood, title, zoning, code violations)?
- Is there a deadline driving the sale (1031 exchange, divorce, estate, relocation)? That informs how much negotiation room exists.
- Schools are A-rated — typically a magnet for longer-tenancy family renters. What's the average tenant stay here, and is there a school-zone premium baked into asking?
- The area grade is low — what's the realistic commute time and amenity access for the typical tenant pool here? Any planned neighborhood developments (good or bad) we should know about?
- What's the average days-on-market for RENTAL listings here right now (not sales)? A rising rental-DOM trend means longer vacancies and softer asking-rent achievability than the comps imply.
CashFlowRE · CFR-S5Q204E5PNX19Y
· Data 4 h ago
cashflowre.app · 2026-05-29