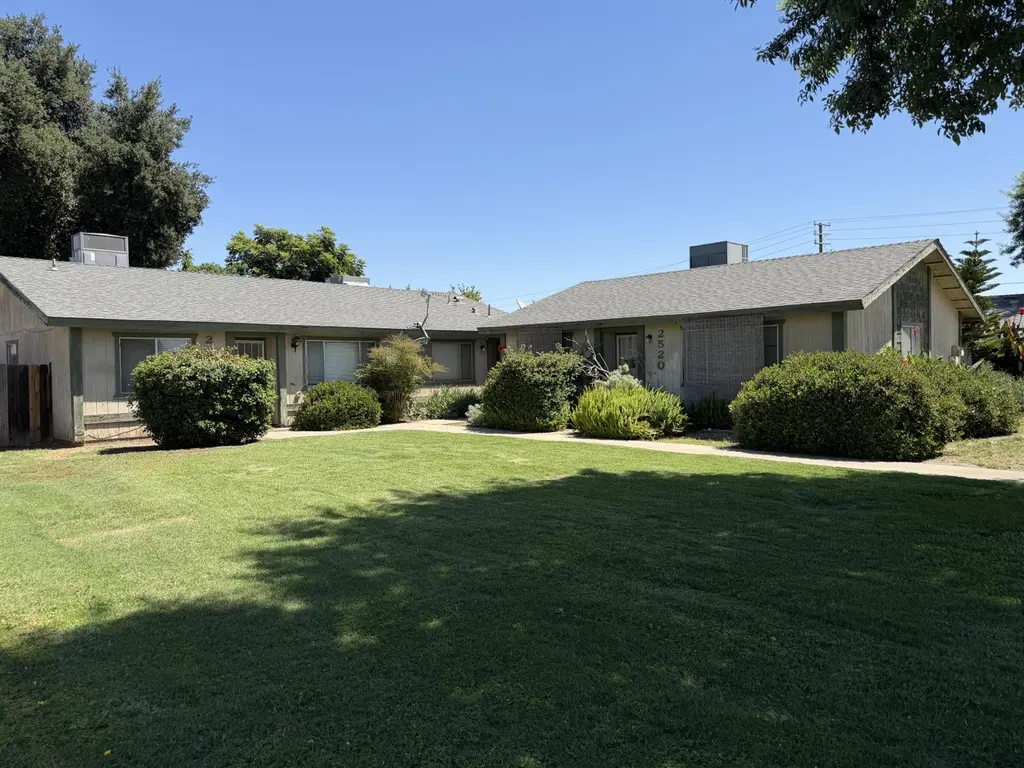
2520-2524 W Victor Ave
Visalia, CA 93277
$600,000D
5 bd · 3.0 ba ·
2,266 sqft ·
Built 1984
· MultiFamily
· Active
· 31 DOM
Cashflow @ list (25.0% down · 7.5%)
Estimated rent
$4,779/mo
Mortgage (P&I)
−$3,146
Tax + insurance
−$449
HOA
−$0
Vac / Maint / Mgmt
−$1,004
Net cashflow
$180/mo
Annual
$2,158/yr
Cap rate
6.65%
Cash-on-cash
1.28%
DSCR
1.06
1% rule
0.80%
Cash to close
$168,000
Investor read
- This is a 2×2bd/1ba + 1×1bd/1ba units multifamily listed at $600k.
- At list price, monthly cash flow is $180 ($2k/yr) — positive. Per door: $60/mo.
- The deal already cash-flows at list — no discount required.
- To meet the 1% rule (rent ≥ 1% of price), the offer needs to be $478k (20.3% below list).
- It's been on market 31 days — a 3% lower offer ($582k) is reasonable based on typical stale-listing flexibility.
- Recommended offer: $478k (20.3% below list) — sets the bar for 1% rule.
- Local home prices are declining (-3.0%/yr); year-one equity from $4k of loan paydown is wiped out by about $18k of value loss. Plan a longer hold.
- Location reads 72/100 on livability (#196 in CA) — a middle-class / working-renter tenant base. Strengths: commute A+, housing A+, employment B; Watch: amenities D, crime D-, cost of living F.
- Visalia Unified (urban): math 30% / reading 40% proficiency, ranked #273 of 517 in CA (top 53%) — families likely to look elsewhere, expect single-tenant / working-renter base with shorter leases.
- Market conditions: Rents rising (+3.3%/yr); 233 active listings in the ZIP; 7 comparable units currently listed for rent nearby; rentals at typical pace (median 22d on market — plan ~3-4 weeks tenant-placement turnaround); solid renter incomes; 1,447 units permitted in Tulare County in 2024 (307 in 5+ unit buildings).
- Tulare County population projected at +10% by 2050 — modest demand growth; plan on rents tracking national, not racing it.
- Climate carrying-cost: major wildfire risk; extreme-heat days projected 7→17/yr by 2055 (HVAC capex compounding) — expect insurance premiums to compound above CPI over the hold.
- Cap rate 6.7% vs local median 3.3% in Visalia — top-decile yield for the area; either an underpriced asset or a hidden risk that comps aren't pricing in. Stress-test before assuming the spread holds.
- At $4,779/mo this rent would consume 71% of the median local household income ($81k/yr) (locally 1896% of renters already pay >50% of income on rent) — very limited rent-growth headroom before tenants either downsize or default.
Questions for listing agent
- It's been on market 31 days. Have you received any prior offers? Is the seller open to a 20% concession, seller financing, or rate buy-down credit?
- Can we see the unit-by-unit rent roll, current vacancy, and any below-market leases? What's the average tenancy length?
- What capital expenditures (roof, boiler, parking lot, exteriors) have been made in the last 5 years, and what's planned in the next 2?
- Is there a deadline driving the sale (1031 exchange, divorce, estate, relocation)? That informs how much negotiation room exists.
- Crime grade is D in this area — have there been break-ins, vandalism, or insurance claims at this property in the last 3 years? What carrier currently insures it and at what premium?
- The area grade is low — what's the realistic commute time and amenity access for the typical tenant pool here? Any planned neighborhood developments (good or bad) we should know about?
- What's the average days-on-market for RENTAL listings here right now (not sales)? A rising rental-DOM trend means longer vacancies and softer asking-rent achievability than the comps imply.
- What's the recent tenant-quality profile in this submarket — average credit score on applications, eviction rate, late-payment / NSF rate, and stable-employment percentage? A property-management company in the area should have these aggregated.
CashFlowRE · CFR-S614202H9QNJVC
· Data 2 days ago
cashflowre.app · 2026-05-29