 Triplex
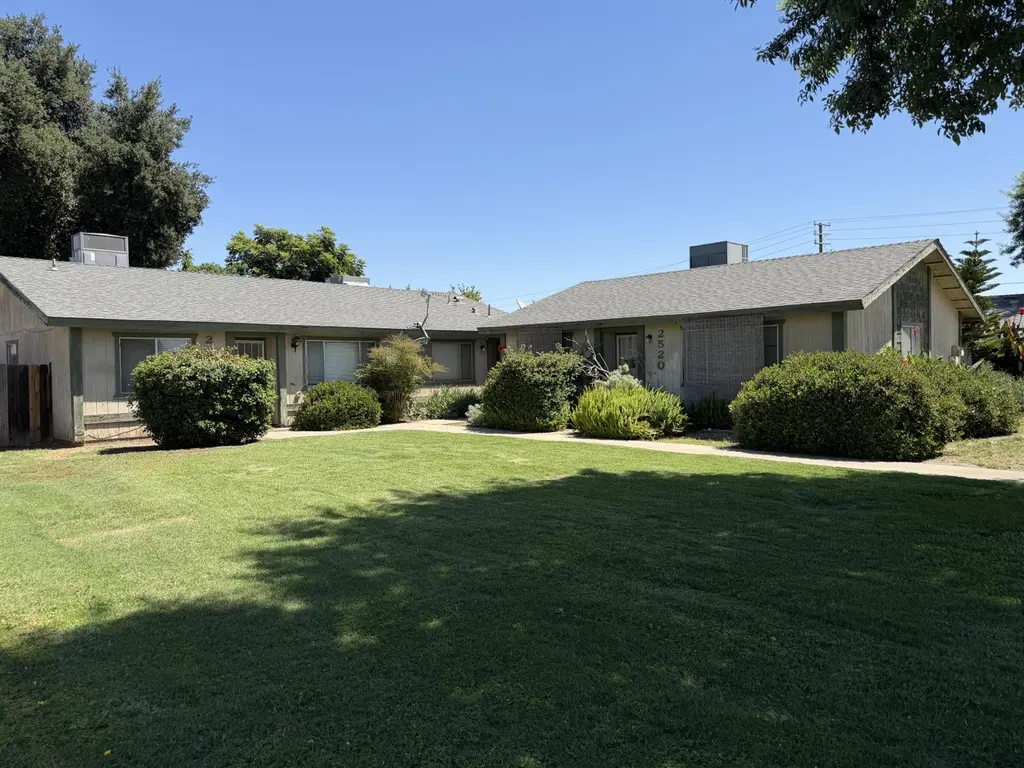
2520-2524 W Victor Ave · Visalia, CA
Flood risk 1/10 · Minimal
- FEMA flood zone
- X (shaded)
- Chance of flooding over 30 yrs
- 0.0%
- Est. flood insurance / yr
- $507 – $1,088
Fire risk 6/10 · Moderate
- Est. fire insurance / yr
- $659 – $1,223
Heat risk 8/10 · Major
- Hot days now (above 105°F)
- 7 days/yr
- Hot days in 30 yrs
- 17 days/yr
Wind risk 1/10 · Minimal
- Chance of severe wind over 30 yrs
- —
Air-quality risk 10/10 · Severe
- Unhealthy air days now
- 40 days/yr
- Unhealthy air days in 30 yrs
- 43 days/yr
Risk factors via First Street. Map © Google.
Why this score? — see what drove the D grade
The composite is a weighted blend of 9 inputs, each scored 0–100. Each bar is that input's sub-score; the figure is the points it added to the 100-point composite (weight × sub-score).
- Cash flow +14.9/30.0
- ARV discount +6.3/15.0
- DSCR +4.6/10.0
- Livability +3.6/5.0
- Rent growth +3.3/5.0
- 1% rule +3.0/10.0
- Schools +3.0/10.0
- Condition / age +2.5/5.0
- Appreciation +0.0/10.0
$600,000
🖨 Deal sheet 📄 Offer letter ✓ Due diligence
Multi-family units
County records classify this as Multi-Family (2-4 Unit). Listing-text estimate: 3 units. confirmed
Listing remarks
Rare investment or multifamily opportunity to own a triplex in Southwest Visalia near the revitalized Sequoia Mall area and highly traveled Mooney Boulevard corridor. With new commercial development, restaurants, and retail continuing to expand nearby, this location offers excellent long-term growth potential and strong rental demand. The property includes two 2-bedroom/1-bath units and one 1-bedroom/1-bath unit, a spacious lawn area, cul-de-sac location, newer roof, and updated HVAC systems. Property has solid fundamentals with opportunity for cosmetic exterior improvements to further enhance value. Tenant occupied. Showings only upon accepted offer subject to inspection. Do not disturb te
Key facts
- Cul-de-sac location
- Strong rental demand
- Newer roof
Tags
Property features AI
Finance
- Financial info: Zoning: RM3
Exterior
- Parking: Covered attached carport
- Utilities: Public water; Public sewer; Water connected; Sewer connected
- Home design: Residential income property; Triplex; Faces south; 2+ shared/common walls; Investment / Multi-family use
- Construction: Wood siding; Slab foundation; Built with wood siding exterior
- Exterior features: Shingle roof; Irregular lot shape; City street frontage; Asphalt road access; Publicly maintained road
Interior
- Heating & cooling: Central Air; Forced Air
- Interior features: Central heating and cooling; Forced air heating; Has a view
Neighborhood map
What this means for you Summary
Snapshot
- This is a 2×2bd/1ba + 1×1bd/1ba units multifamily listed at $600k.
Deal economics
- At list price, monthly cash flow is $180 ($2k/yr) — positive. Per door: $60/mo.
- The deal already cash-flows at list — no discount required.
- To meet the 1% rule (rent ≥ 1% of price), the offer needs to be $478k (20.3% below list).
- Recommended offer: $478k (20.3% below list) — sets the bar for 1% rule.
- Cap rate 6.7% vs local median 3.3% in Visalia — top-decile yield for the area; either an underpriced asset or a hidden risk that comps aren't pricing in. Stress-test before assuming the spread holds.
Location & tenants
- Location reads 72/100 on livability (#196 in CA) — a middle-class / working-renter tenant base. Strengths: commute A+, housing A+, employment B; Watch: amenities D, crime D-, cost of living F.
- Visalia Unified (urban): math 30% / reading 40% proficiency, ranked #273 of 517 in CA (top 53%) — families likely to look elsewhere, expect single-tenant / working-renter base with shorter leases.
- Market conditions: Rents rising (+3.3%/yr); 233 active listings in the ZIP; 7 comparable units currently listed for rent nearby; rentals at typical pace (median 22d on market — plan ~3-4 weeks tenant-placement turnaround); solid renter incomes; 1,447 units permitted in Tulare County in 2024 (307 in 5+ unit buildings).
- At $4,779/mo this rent would consume 71% of the median local household income ($81k/yr) (locally 1896% of renters already pay >50% of income on rent) — very limited rent-growth headroom before tenants either downsize or default.
Forward outlook
- Local home prices are declining (-3.0%/yr); year-one equity from $4k of loan paydown is wiped out by about $18k of value loss. Plan a longer hold.
- Tulare County population projected at +10% by 2050 — modest demand growth; plan on rents tracking national, not racing it.
Negotiation context
- It's been on market 31 days — a 3% lower offer ($582k) is reasonable based on typical stale-listing flexibility.
Risks & watch-outs
- Climate carrying-cost: major wildfire risk; extreme-heat days projected 7→17/yr by 2055 (HVAC capex compounding) — expect insurance premiums to compound above CPI over the hold.
Questions for the listing agent
- It's been on market 31 days. Have you received any prior offers? Is the seller open to a 20% concession, seller financing, or rate buy-down credit?
- Can we see the unit-by-unit rent roll, current vacancy, and any below-market leases? What's the average tenancy length?
- What capital expenditures (roof, boiler, parking lot, exteriors) have been made in the last 5 years, and what's planned in the next 2?
- Is there a deadline driving the sale (1031 exchange, divorce, estate, relocation)? That informs how much negotiation room exists.
- Crime grade is D in this area — have there been break-ins, vandalism, or insurance claims at this property in the last 3 years? What carrier currently insures it and at what premium?
- The area grade is low — what's the realistic commute time and amenity access for the typical tenant pool here? Any planned neighborhood developments (good or bad) we should know about?
- What's the average days-on-market for RENTAL listings here right now (not sales)? A rising rental-DOM trend means longer vacancies and softer asking-rent achievability than the comps imply.
- What's the recent tenant-quality profile in this submarket — average credit score on applications, eviction rate, late-payment / NSF rate, and stable-employment percentage? A property-management company in the area should have these aggregated.
- How much new apartment / multifamily construction is in the pipeline within 1–3 miles? Heavy new supply (>2% of stock underway) typically softens rents 12–24 months out; light construction supports rent growth.
Investment metrics
- 1% rule
- 0.80% ✗
- Cap rate
- 6.65%
- Cash-on-cash
- 1.28%
- DSCR
- 1.06
- GRM
- 10.5
CMA / ARV
- ARV (on-the-fly)
- $584,628
- Comps found
- 3
Show comp detail 3 sales within ~0.75 mi
| Address | Dist | Beds/Ba | Sqft | Sold | Price | $/sf | Match |
|---|---|---|---|---|---|---|---|
| 2532 W Chestnut | 0.07mi | 6/3.0 (+1) | 2,483 (+10%) | 2mo | $572,500 | $231 | 74 |
| 3614 S County Center Dr | 0.32mi | 5/4.0 | 2,325 (+3%) | 9mo | $600,000 | $258 | 70 |
| 3624 S County Center Dr | 0.33mi | 5/4.0 | 2,325 (+3%) | 9mo | $600,000 | $258 | 69 |
Match score weights: distance 35% · size 25% · config 20% · recency 20%. Top-matched comps best support the ARV.
Projected returns pro-forma
-3.0% appreciation · 3.32% rent growth · sell at horizon
- IRR
- -14.0%
- Equity multiple
- 0.50×
- Total profit
- $-84,496
- Equity at exit
- $89,462
- IRR
- -4.8%
- Equity multiple
- 0.68×
- Total profit
- $-53,537
- Equity at exit
- $51,877
Cash invested: $168,000 (down + closing). Projections, not guarantees.
Landlord ↔ Tenant lean methodology
- Overall (STATE)
- 18 Strongly Tenant-Friendly
- State California
- 18 Strongly Tenant-Friendly · D+13
- County
- — inherits STATE
- City
- — inherits STATE
ZIP-level market 93277
- Rents YoY
- 3.3%
- Active inventory
- 233
- Price-to-rent
- 30.9×
Monthly cashflow live
- Estimated rent
- $4,779 high interval (Pro) →
- Mortgage (P&I)
- −$3,146
- Tax from tax record
- −$199 /mo · $2,390/yr
- Insurance
- −$250
- HOA
- −$0
- Vacancy / Maint / Mgmt
- −$1,004
- Net cashflow
- $180
Break-even live
3-unit breakdown (identical units grouped — click to expand)
| Units | Beds | Baths | Est. rent |
|---|---|---|---|
| 2× units | 2 | 1 | $3,234 |
| #1 | 2 | 1 | $1,617 |
| #2 | 2 | 1 | $1,617 |
| 1× unit | 1 | 1 | $1,545 |
| Total (3 units) | $4,779 | ||
UW: 25.0% down · 7.5% · 30yr · 1.5% tax · 5.0% vac · 8.0% maint · 8.0% mgmt
Financing live
Cash to close
- Down payment
- $150,000
- Closing costs
- $18,000
- Reserves months
- —
- Total cash needed
- —
Loan-product check · same deal, 3 products live
Conventional
25% down · 7.5% · 30yr
- Down + closing
- —
- Monthly P&I
- —
- Monthly cashflow
- —
- DSCR
- —
- Eligible?
- —
Personal DTI + credit; lowest rate.
DSCR
20% down · 8.5% · 30yr
- Down + closing
- —
- Monthly P&I
- —
- Monthly cashflow
- —
- DSCR
- —
- Eligible?
- —
No personal income docs; deal must DSCR.
Hard money
10% down · 12.0% · 12mo
- Down + closing
- —
- Monthly P&I
- —
- Monthly cashflow
- —
- DSCR
- —
- Eligible?
- —
Short-term bridge; refi at stabilization.
Rent comps 7 comps
| Address | Beds | Baths | Sqft | Rent | $/sqft | DOM | Units | Dist |
|---|---|---|---|---|---|---|---|---|
| 3432 S Martin Ct Visalia, CA | 4.0 | 2.0 | 1696 | $2,300 | $1.36 | 21d | 1 | 0.72mi |
| 2344 W Walnut Ave Visalia, CA | 4.0 | 3.0 | 1838 | $2,375 | $1.29 | 14d | 1 | 0.78mi |
| 4537 S Ernest St Visalia, CA | 4.0 | 3.5 | 2537 | $2,700 | $1.06 | 44d | 1 | 1.00mi |
| 4227 S Fontana St Visalia, CA | 4.0 | 3.0 | 2276 | $2,700 | $1.19 | 21d | 1 | 1.14mi |
| 4448 W Rialto Ave Visalia, CA | 4.0 | 2.5 | 2144 | $2,395 | $1.12 | 21d | 1 | 1.27mi |
| 1212 S Demaree St Visalia, CA | 4.0 | 2.0 | 1644 | $2,500 | $1.52 | 44d | 1 | 1.41mi |
| 1120 W Howard Ave Visalia, CA | 4.0 | 2.0 | 1850 | $2,800 | $1.51 | 21d | 1 | 1.43mi |
Listing history 17 events
-
2026-06-18days on market $600,000 Active 31 DOM
-
2026-06-17days on market $600,000 Active 30 DOM
-
2026-06-16days on market $600,000 Active 29 DOM
-
2026-06-15days on market $600,000 Active 28 DOM
-
2026-06-14days on market $600,000 Active 26 DOM
-
2026-06-13days on market $600,000 Active 25 DOM
-
2026-06-10days on market $600,000 Active 23 DOM
-
2026-06-09days on market $600,000 Active 22 DOM
-
2026-06-08days on market $600,000 Active 21 DOM
-
2026-06-07days on market $600,000 Active 20 DOM
-
2026-06-05days on market $600,000 Active 17 DOM
-
2026-06-03days on market $600,000 Active 16 DOM
-
2026-06-02days on market $600,000 Active 15 DOM
-
2026-06-01days on market $600,000 Active 14 DOM
-
2026-05-31days on market $600,000 Active 13 DOM
-
2026-05-30days on market $600,000 Active 12 DOM
-
2026-05-18$600,000 Active
ⓘ Source: listings_history table (triggers on properties + properties_extension) + one-shot
backfill from property_details.listing_events for pre-trigger history.
Tax reassessment forecast CA · Resets to sale price
- Current annual tax
- $2,390 · $199/mo
- Projected year-2 tax
- $4,560 · $380/mo
- Expected delta
- +$2,170/yr (+$181/mo · 90.8%)
ⓘ Screening estimate from a state-policy table — verify with the county assessor before closing.
Climate risk First Street
- Flood 1/10 Low FEMA zone X (shaded) · 0% chance over 30 yrs
- Wildfire 6/10 Major
- Heat 8/10 Severe 7 d/yr ≥105°F today · 17 d/yr by 30 yrs out
- Wind 1/10 Low
- Air quality 10/10 Extreme 40 unhealthy d/yr today · 43 by 30 yrs out
Nearby sold comps map
Loading sold comps map…
Walkable amenities ~0.75 mi
Loading nearby amenities…
Taxation est. · year 1
- Rental income
- $57,348
- − Mortgage interest
- −$33,609
- − Property taxes
- −$2,390
- − Insurance
- −$3,000
- − Repairs & maintenance
- −$4,588
- − Management
- −$4,588
- − Depreciation
- −$17,455
- Taxable loss
- −$8,281
- Est. tax savings @ 24.0%
- +$1,987
- After-tax cash flow
- $4,145/yr
For passive investors: Depreciation is non-cash, so a rental often shows a tax loss while cash-flowing — sheltering income. Rental losses are passive: they offset passive income freely, and up to $25,000/yr can offset ordinary (W-2) income if you actively participate and your MAGI is under $100k (phasing out to $0 by $150k); unused losses carry forward. On sale, claimed depreciation is recaptured at up to 25%, and gains may owe capital-gains tax (a 1031 exchange can defer both). Figures are a year-1 estimate at your 24.0% rate — not tax advice; consult a CPA.
Schools (NCES district)
- District
- Visalia Unified
- NCES district ID
- 0641160
- Math proficiency
- 30% ▼ -3.00%
- Reading proficiency
- 40% ▼ -10.00%
- Median HH income
- $51,672
- Composite
- 30.47/100
- National rank
- #6223
- State rank
- #273 of 517 in CA
Livability — Visalia
- Score
- 72/100
- State rank
- #196
- US rank
- #6351
Category grades
Schools grade is shown separately in the Schools card above.
Census & demographics
- Census place
- Visalia, CA
- County
- Tulare County · 323,826 people
- City population
- 163,333
- Metro
- Visalia, CA
- Population (ZIP)
- 53,985
- Household income
- $80,548
- Rent vs Own
- Severe rent burden
- 1896.0
Population outlook (Tulare County) Hauer SSP2
- Today (2025)
- 484,681 people
- By 2030
- 496,241 · +2.4%
- By 2040
- 518,507 · +7.0%
- By 2050
- 534,920 · +10.4%
- By 2075
- 548,417 · +13.2%
- By 2100
- 513,085 · +5.9%
Race, ethnicity, and origin ACS 2023
- Neighborhood character
- Diverse neighborhood (Simpson 0.60)
- Race & ethnicity
- Hispanic / Latino 48% White 40% Two or more races 21% Asian 4% Black 2% Native American 2%
- Hispanic origin (detail)
- Mexican 44%
- Common ancestry
- Russian 3% Iranian 2% Italian 2%
- Foreign-born
- 12% · Canada, China
- Languages at home
- 73% English-only · Spanish 22% Chinese 2% Other Asian/Pacific 1%
Political lean MEDSL · Tulare
- 2024 margin
- Strong R (+20.7) · D 38.5% · R 59.2% · Other 2.3%
- 2008→2024 swing
- -5.4pp toward R · 2008: -15.3pp · 2024: -20.7pp
- All cycles
- 2024: R+20.7 2020: R+7.8 2016: R+12.1 2012: R+17.8 2008: R+15.3
Not yet ingested
- Civics
- —
Market trends
- HPI YoY
- ▼ -371.43%
- Current HPI
- 310.349
- Rent YoY
- ▲ 3.32%
- Metro
- Visalia, CA
- State GDP YoY
- ▲ 3.21%
- F500 in state
- 116
Industry mix (Fortune 500 HQ in CA)
| Industry | F500 HQs | Revenue |
|---|---|---|
| Technology | 27 | $1,492B |
|
||
| Financial Services | 3 | $174B |
|
||
| Retail | 3 | $44B |
|
||
| Insurance | 3 | $26B |
|
||
| Media / Entertainment | 2 | $115B |
|
||
| Pharmaceuticals / Biotech | 2 | $62B |
|
||
Price history
1 event — show timeline
- 2026-05-18 Listed $600,000 TCMLS
Property tax history
+2.0%/yrLatest (2025): $2,390 · +3.0% YoY. Source: county tax records.
Cash-flow waterfall
monthlySold comps — $/sqft
last 12 mo · ≤1 miLoading sold comps…