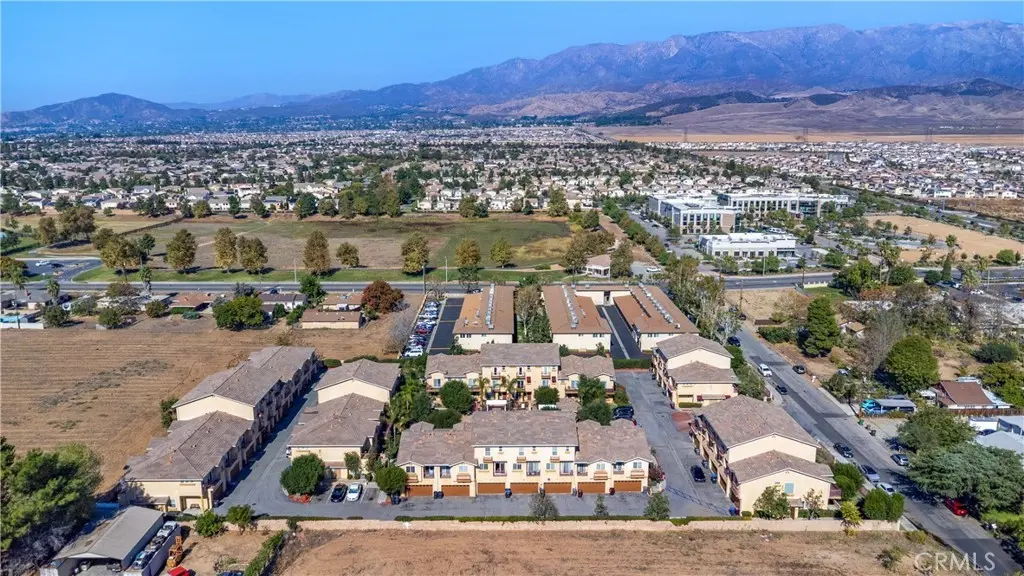
703 Allegheny
Beaumont, CA 92223
$11,995,000C-
None bd · 4000.0 ba ·
64,254 sqft ·
Built 2009
· MultiFamily
· Active
· 163 DOM
Cashflow @ list (25.0% down · 7.5%)
Estimated rent
$115,575/mo
Mortgage (P&I)
−$62,903
Tax + insurance
−$19,992
HOA
−$0
Vac / Maint / Mgmt
−$24,271
Net cashflow
$8,409/mo
Annual
$100,914/yr
Cap rate
7.13%
Cash-on-cash
3.00%
DSCR
1.13
1% rule
0.96%
Cash to close
$3,358,600
Investor read
- This is a 20×2bd/2ba + 20×3bd/2ba units multifamily listed at $11.99M. Condition is rated good.
- At list price, monthly cash flow is $8k ($101k/yr) — positive. Per door: $210/mo.
- The deal already cash-flows at list — no discount required.
- To meet the 1% rule (rent ≥ 1% of price), the offer needs to be $11.56M (3.6% below list).
- It's been on market 163 days — a 12% lower offer ($10.56M) is reasonable based on typical stale-listing flexibility.
- Recommended offer: $10.56M (12.0% below list) — sets the bar for market timing.
- Local home prices are declining (-3.0%/yr); year-one equity from $83k of loan paydown is wiped out by about $360k of value loss. Plan a longer hold.
- Location reads 64/100 on livability (#429 in CA) — a middle-class / working-renter tenant base. Strengths: employment A+, housing A+, crime A-; Watch: amenities F, commute F, cost of living F.
- Beaumont Unified (suburban): math 32% / reading 60% proficiency, ranked #168 of 517 in CA (top 32%) — families likely to look elsewhere, expect single-tenant / working-renter base with shorter leases.
- Market conditions: Rents rising (+3.9%/yr); 276 active listings in the ZIP; solid renter incomes; 9,195 units permitted in Riverside County in 2024 (1,512 in 5+ unit buildings).
- Riverside County population projected at +22% by 2050 — long-run rental-demand tailwind backs the buy-and-hold thesis.
- Cap rate 7.1% vs local median 3.5% in Beaumont — top-decile yield for the area; either an underpriced asset or a hidden risk that comps aren't pricing in. Stress-test before assuming the spread holds.
- At $115,575/mo this rent would consume 1350% of the median local household income ($103k/yr) (locally 1096% of renters already pay >50% of income on rent) — very limited rent-growth headroom before tenants either downsize or default.
Questions for listing agent
- It's been on market 163 days. Have you received any prior offers? Is the seller open to a 12% concession, seller financing, or rate buy-down credit?
- Can we see the unit-by-unit rent roll, current vacancy, and any below-market leases? What's the average tenancy length?
- What capital expenditures (roof, boiler, parking lot, exteriors) have been made in the last 5 years, and what's planned in the next 2?
- Why hasn't it sold? Are there any deal-killer items the seller is aware of (foundation, flood, title, zoning, code violations)?
- Is there a deadline driving the sale (1031 exchange, divorce, estate, relocation)? That informs how much negotiation room exists.
- What's the average days-on-market for RENTAL listings here right now (not sales)? A rising rental-DOM trend means longer vacancies and softer asking-rent achievability than the comps imply.
- What's the recent tenant-quality profile in this submarket — average credit score on applications, eviction rate, late-payment / NSF rate, and stable-employment percentage? A property-management company in the area should have these aggregated.
- How much new apartment / multifamily construction is in the pipeline within 1–3 miles? Heavy new supply (>2% of stock underway) typically softens rents 12–24 months out; light construction supports rent growth.
CashFlowRE · CFR-S63FHVCJ1R4E8P
· Data 2 days ago
cashflowre.app · 2026-05-29