 40-Plex
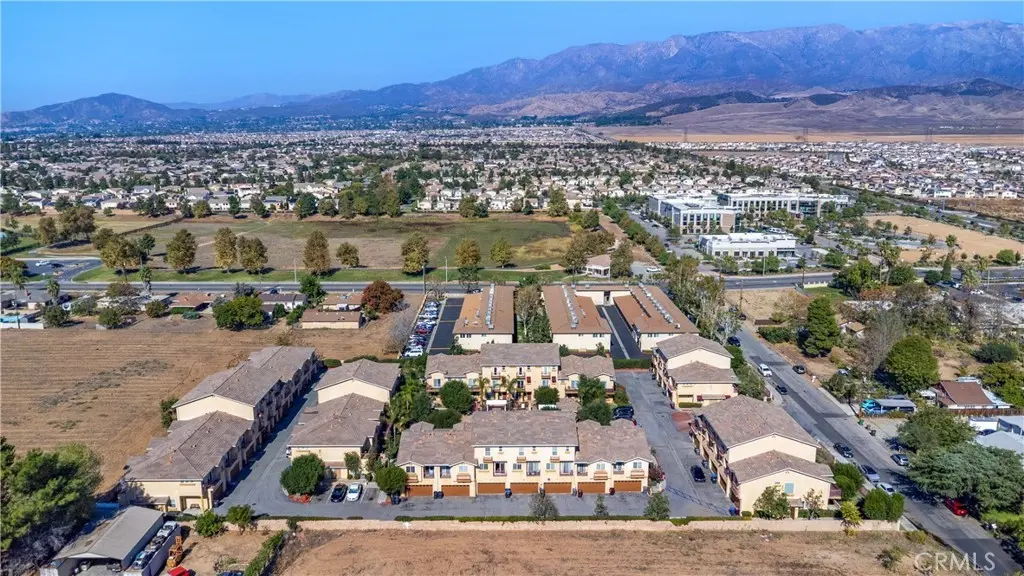
703 Allegheny · Beaumont, CA
Flood risk No data
- FEMA flood zone
- —
- Chance of flooding over 30 yrs
- —
- Est. flood insurance / yr
- —
Fire risk No data
- Est. fire insurance / yr
- —
Heat risk No data
- Hot days now (above threshold)
- —
- Hot days in 30 yrs
- —
Wind risk No data
- Chance of severe wind over 30 yrs
- —
Air-quality risk No data
- Unhealthy air days now
- —
- Unhealthy air days in 30 yrs
- —
Risk factors via First Street. Map © Google.
Why this score? — see what drove the C- grade
The composite is a weighted blend of 9 inputs, each scored 0–100. Each bar is that input's sub-score; the figure is the points it added to the 100-point composite (weight × sub-score).
- Cash flow +17.1/30.0
- ARV discount +9.1/15.0
- DSCR +5.3/10.0
- 1% rule +4.6/10.0
- Schools +4.0/10.0
- Condition / age +3.8/5.0
- Rent growth +3.5/5.0
- Livability +3.2/5.0
- Appreciation +0.0/10.0
$11,995,000
🖨 Deal sheet 📄 Offer letter ✓ Due diligence
Multi-family units
County records classify this as Multi-Family (5+ Unit). Listing-text estimate: 40 units. confirmed
5+ unit building — per-unit beds/baths from public records are typically unavailable; the breakdown below (if shown) is an estimate from the listing text.
Listing remarks MLS
* * * $855,000 Price Reduction * * * Constructed in 2008, The Tuscany Villas is a 40-unit apartment community that is managed on-site and offers investors desirable amenities as it was built as a condominium complex with each unit situated on its own tax assessor parcel. The property features 100% two and three bedroom townhouse units with connecting two and three car gargaes, an uncommon feature in similar sized, garden-style communities. The townhouses further distinguish themselves with vaulted ceilings enhancing natural light and offering a more spacious, modern living experience. Bordered by Mount San Gorgonio and Mount San Jacinto, Beaumont is one of the fastest-growing cities in Riverside County. This combination of location, design, and amenities ensures strong renter demand and positions the property for substantial rent and income growth as units are brought to market levels. 100% 3 & 2 bedroom townhouse units • Connecting 3 & 2 car garages • Built in 2008 as condominiums (individual parcels) • Well managed with on-site management & excellent tenant profile • Sparkling pool, spa, playground & BBQ area • Priced below replacement cost at under $187 per foot • Spacious units offering 3 different floor plans • Average of ±1,606 square foot units • Central AC/heat & individual hot water heaters • Large ±2.45 Acre parcel • ±1 mile with easy access to the I-10 freeway
Key facts
- Large parcel
- Spa
- Bbq area
Tags
Neighborhood map
What this means for you Summary
Snapshot
- This is a 20×2bd/2ba + 20×3bd/2ba units multifamily listed at $11.99M. Condition is rated good.
Deal economics
- At list price, monthly cash flow is $8k ($101k/yr) — positive. Per door: $210/mo.
- The deal already cash-flows at list — no discount required.
- To meet the 1% rule (rent ≥ 1% of price), the offer needs to be $11.56M (3.6% below list).
- Recommended offer: $10.56M (12.0% below list) — sets the bar for market timing.
- Cap rate 7.1% vs local median 3.5% in Beaumont — top-decile yield for the area; either an underpriced asset or a hidden risk that comps aren't pricing in. Stress-test before assuming the spread holds.
Location & tenants
- Location reads 64/100 on livability (#429 in CA) — a middle-class / working-renter tenant base. Strengths: employment A+, housing A+, crime A-; Watch: amenities F, commute F, cost of living F.
- Beaumont Unified (suburban): math 32% / reading 60% proficiency, ranked #168 of 517 in CA (top 32%) — families likely to look elsewhere, expect single-tenant / working-renter base with shorter leases.
- Market conditions: Rents rising (+3.9%/yr); 276 active listings in the ZIP; solid renter incomes; 9,195 units permitted in Riverside County in 2024 (1,512 in 5+ unit buildings).
- At $115,575/mo this rent would consume 1350% of the median local household income ($103k/yr) (locally 1096% of renters already pay >50% of income on rent) — very limited rent-growth headroom before tenants either downsize or default.
Forward outlook
- Local home prices are declining (-3.0%/yr); year-one equity from $83k of loan paydown is wiped out by about $360k of value loss. Plan a longer hold.
- Riverside County population projected at +22% by 2050 — long-run rental-demand tailwind backs the buy-and-hold thesis.
Negotiation context
- It's been on market 163 days — a 12% lower offer ($10.56M) is reasonable based on typical stale-listing flexibility.
Questions for the listing agent
- It's been on market 163 days. Have you received any prior offers? Is the seller open to a 12% concession, seller financing, or rate buy-down credit?
- Can we see the unit-by-unit rent roll, current vacancy, and any below-market leases? What's the average tenancy length?
- What capital expenditures (roof, boiler, parking lot, exteriors) have been made in the last 5 years, and what's planned in the next 2?
- Why hasn't it sold? Are there any deal-killer items the seller is aware of (foundation, flood, title, zoning, code violations)?
- Is there a deadline driving the sale (1031 exchange, divorce, estate, relocation)? That informs how much negotiation room exists.
- What's the average days-on-market for RENTAL listings here right now (not sales)? A rising rental-DOM trend means longer vacancies and softer asking-rent achievability than the comps imply.
- What's the recent tenant-quality profile in this submarket — average credit score on applications, eviction rate, late-payment / NSF rate, and stable-employment percentage? A property-management company in the area should have these aggregated.
- How much new apartment / multifamily construction is in the pipeline within 1–3 miles? Heavy new supply (>2% of stock underway) typically softens rents 12–24 months out; light construction supports rent growth.
Investment metrics
- 1% rule
- 0.96% ✗
- Cap rate
- 7.13%
- Cash-on-cash
- 3.00%
- DSCR
- 1.13
- GRM
- 8.6
CMA / ARV
- ARV (median comp)
- $12,445,128
- List price
- $11,995,000
- Delta
- -3.62%
- Verdict
- FAIR
- Comps
- 2 within 2.0 mi
Projected returns pro-forma
-3.0% appreciation · 3.85% rent growth · sell at horizon
- IRR
- -10.6%
- Equity multiple
- 0.61×
- Total profit
- $-1,306,680
- Equity at exit
- $1,788,494
- IRR
- -0.1%
- Equity multiple
- 0.99×
- Total profit
- $-24,912
- Equity at exit
- $1,037,108
Cash invested: $3,358,600 (down + closing). Projections, not guarantees.
Landlord ↔ Tenant lean methodology
- Overall (STATE)
- 18 Strongly Tenant-Friendly
- State California
- 18 Strongly Tenant-Friendly · D+13
- County
- — inherits STATE
- City
- — inherits STATE
ZIP-level market 92223
- Rents YoY
- 3.9%
- Active inventory
- 276
- Price-to-rent
- 368.2×
Monthly cashflow live
- Estimated rent
- $115,575 high interval (Pro) →
- Mortgage (P&I)
- −$62,903
- Tax est. 1.5%
- −$14,994 /mo · $179,925/yr
- Insurance
- −$4,998
- HOA
- −$0
- Vacancy / Maint / Mgmt
- −$24,271
- Net cashflow
- $8,409
Break-even live
40-unit breakdown (identical units grouped — click to expand)
| Units | Beds | Baths | Est. rent |
|---|---|---|---|
| 20× units | 2 | 2 | $54,300 |
| #1 | 2 | 2 | $2,715 |
| #2 | 2 | 2 | $2,715 |
| #3 | 2 | 2 | $2,715 |
| #4 | 2 | 2 | $2,715 |
| #5 | 2 | 2 | $2,715 |
| #6 | 2 | 2 | $2,715 |
| #7 | 2 | 2 | $2,715 |
| #8 | 2 | 2 | $2,715 |
| #9 | 2 | 2 | $2,715 |
| #10 | 2 | 2 | $2,715 |
| #11 | 2 | 2 | $2,715 |
| #12 | 2 | 2 | $2,715 |
| #13 | 2 | 2 | $2,715 |
| #14 | 2 | 2 | $2,715 |
| #15 | 2 | 2 | $2,715 |
| #16 | 2 | 2 | $2,715 |
| #17 | 2 | 2 | $2,715 |
| #18 | 2 | 2 | $2,715 |
| #19 | 2 | 2 | $2,715 |
| #20 | 2 | 2 | $2,715 |
| 20× units | 3 | 2 | $61,280 |
| #21 | 3 | 2 | $3,064 |
| #22 | 3 | 2 | $3,064 |
| #23 | 3 | 2 | $3,064 |
| #24 | 3 | 2 | $3,064 |
| #25 | 3 | 2 | $3,064 |
| #26 | 3 | 2 | $3,064 |
| #27 | 3 | 2 | $3,064 |
| #28 | 3 | 2 | $3,064 |
| #29 | 3 | 2 | $3,064 |
| #30 | 3 | 2 | $3,064 |
| #31 | 3 | 2 | $3,064 |
| #32 | 3 | 2 | $3,064 |
| #33 | 3 | 2 | $3,064 |
| #34 | 3 | 2 | $3,064 |
| #35 | 3 | 2 | $3,064 |
| #36 | 3 | 2 | $3,064 |
| #37 | 3 | 2 | $3,064 |
| #38 | 3 | 2 | $3,064 |
| #39 | 3 | 2 | $3,064 |
| #40 | 3 | 2 | $3,064 |
| Total (40 units) | $115,575 | ||
UW: 25.0% down · 7.5% · 30yr · 1.5% tax · 5.0% vac · 8.0% maint · 8.0% mgmt
Financing live
Cash to close
- Down payment
- $2,998,750
- Closing costs
- $359,850
- Reserves months
- —
- Total cash needed
- —
Loan-product check · same deal, 3 products live
Conventional
25% down · 7.5% · 30yr
- Down + closing
- —
- Monthly P&I
- —
- Monthly cashflow
- —
- DSCR
- —
- Eligible?
- —
Personal DTI + credit; lowest rate.
DSCR
20% down · 8.5% · 30yr
- Down + closing
- —
- Monthly P&I
- —
- Monthly cashflow
- —
- DSCR
- —
- Eligible?
- —
No personal income docs; deal must DSCR.
Hard money
10% down · 12.0% · 12mo
- Down + closing
- —
- Monthly P&I
- —
- Monthly cashflow
- —
- DSCR
- —
- Eligible?
- —
Short-term bridge; refi at stabilization.
Listing history 16 events
-
2026-06-18days on market $11,995,000 Active 163 DOM
-
2026-06-17days on market $11,995,000 Active 162 DOM
-
2026-06-16days on market $11,995,000 Active 161 DOM
-
2026-06-15days on market $11,995,000 Active 160 DOM
-
2026-06-13days on market $11,995,000 Active 158 DOM
-
2026-06-13days on market $11,995,000 Active 157 DOM
-
2026-06-09days on market $11,995,000 Active 154 DOM
-
2026-06-08days on market $11,995,000 Active 153 DOM
-
2026-06-07days on market $11,995,000 Active 152 DOM
-
2026-06-04days on market $11,995,000 Active 149 DOM
-
2026-06-03days on market $11,995,000 Active 148 DOM
-
2026-06-02days on market $11,995,000 Active 147 DOM
-
2026-06-01days on market $11,995,000 Active 146 DOM
-
2026-05-31days on market $11,995,000 Active 145 DOM
-
2026-02-12price $11,995,000 1525-char remark
Show marketing remark (1525 chars)
* * * $855,000 Price Reduction * * * Constructed in 2008, The Tuscany Villas is a 40-unit apartment community that is managed on-site and offers investors desirable amenities as it was built as a condominium complex with each unit situated on its own tax assessor parcel. The property features 100% two and three bedroom townhouse units with connecting two and three car gargaes, an uncommon feature in similar sized, garden-style communities. The townhouses further distinguish themselves with vaulted ceilings enhancing natural light and offering a more spacious, modern living experience. Bordered by Mount San Gorgonio and Mount San Jacinto, Beaumont is one of the fastest-growing cities in Riverside County. This combination of location, design, and amenities ensures strong renter demand and positions the property for substantial rent and income growth as units are brought to market levels. 100% 3 & 2 bedroom townhouse units • Connecting 3 & 2 car garages • Built in 2008 as condominiums (individual parcels) • Well managed with on-site management & excellent tenant profile • Sparkling pool, spa, playground & BBQ area • Priced below replacement cost at under $187 per foot • Spacious units offering 3 different floor plans • Average of ±1,606 square foot units • Central AC/heat & individual hot water heaters • Large ±2.45 Acre parcel • ±1 mile with easy access to the I-10 freeway
-
2026-01-06$12,850,000 Active 1525-char remark
Show marketing remark (1525 chars)
* * * $855,000 Price Reduction * * * Constructed in 2008, The Tuscany Villas is a 40-unit apartment community that is managed on-site and offers investors desirable amenities as it was built as a condominium complex with each unit situated on its own tax assessor parcel. The property features 100% two and three bedroom townhouse units with connecting two and three car gargaes, an uncommon feature in similar sized, garden-style communities. The townhouses further distinguish themselves with vaulted ceilings enhancing natural light and offering a more spacious, modern living experience. Bordered by Mount San Gorgonio and Mount San Jacinto, Beaumont is one of the fastest-growing cities in Riverside County. This combination of location, design, and amenities ensures strong renter demand and positions the property for substantial rent and income growth as units are brought to market levels. 100% 3 & 2 bedroom townhouse units • Connecting 3 & 2 car garages • Built in 2008 as condominiums (individual parcels) • Well managed with on-site management & excellent tenant profile • Sparkling pool, spa, playground & BBQ area • Priced below replacement cost at under $187 per foot • Spacious units offering 3 different floor plans • Average of ±1,606 square foot units • Central AC/heat & individual hot water heaters • Large ±2.45 Acre parcel • ±1 mile with easy access to the I-10 freeway
ⓘ Source: listings_history table (triggers on properties + properties_extension) + one-shot
backfill from property_details.listing_events for pre-trigger history.
Nearby sold comps map
Loading sold comps map…
Walkable amenities ~0.75 mi
Loading nearby amenities…
Taxation est. · year 1
- Rental income
- $1,386,900
- − Mortgage interest
- −$671,906
- − Property taxes
- −$179,925
- − Insurance
- −$59,975
- − Repairs & maintenance
- −$110,952
- − Management
- −$110,952
- − Depreciation
- −$348,945
- Taxable loss
- −$95,756
- Est. tax savings @ 24.0%
- +$22,981
- After-tax cash flow
- $123,895/yr
For passive investors: Depreciation is non-cash, so a rental often shows a tax loss while cash-flowing — sheltering income. Rental losses are passive: they offset passive income freely, and up to $25,000/yr can offset ordinary (W-2) income if you actively participate and your MAGI is under $100k (phasing out to $0 by $150k); unused losses carry forward. On sale, claimed depreciation is recaptured at up to 25%, and gains may owe capital-gains tax (a 1031 exchange can defer both). Figures are a year-1 estimate at your 24.0% rate — not tax advice; consult a CPA.
Condition & rehab AI · 11 photos
The property is in good condition with no visible damage or wear. It has a good curb appeal and is located in a desirable area with a pool and other amenities. Painting the exterior walls and roof, updating the flooring, and upgrading the kitchen appliances can increase the property's value for both resale and rental.
Value-add opportunities
- Both Painting the exterior walls and roof — Painting the exterior walls and roof can improve the curb appeal and increase the property's value for both resale and rental.
- Both Updating the flooring — Updating the flooring can improve the overall look and feel of the property, making it more appealing to potential buyers or renters.
- Both Upgrading the kitchen appliances — Upgrading the kitchen appliances can make the property more attractive to potential buyers or renters, as it can add value to the property.
Renovation cost estimate screening
Value-add ROI direction
- Both Painting the exterior walls and roof — Painting the exterior walls and roof can improve the curb appeal and increase the property's value for both resale and rental. ↑
- Both Updating the flooring — Updating the flooring can improve the overall look and feel of the property, making it more appealing to potential buyers or renters. ↑
- Both Upgrading the kitchen appliances — Upgrading the kitchen appliances can make the property more attractive to potential buyers or renters, as it can add value to the property. ↑
ⓘ Cost ranges are severity-bucket heuristics (US national rule-of-thumb). Get contractor quotes + a written scope before underwriting a rehab budget.
Schools (NCES district)
- District
- Beaumont Unified
- NCES district ID
- 0604290
- Math proficiency
- 32% ▼ -4.00%
- Reading proficiency
- 60% ▲ 11.00%
- Median HH income
- $60,635
- Composite
- 40.37/100
- National rank
- #3736
- State rank
- #168 of 517 in CA
Livability — Beaumont
- Score
- 64/100
- State rank
- #429
- US rank
- #14526
Category grades
Schools grade is shown separately in the Schools card above.
Census & demographics
- Census place
- Beaumont, CA
- County
- Riverside County · 2,287,001 people
- City population
- 63,833
- Metro
- Riverside-San Bernardino-Ontario, CA
- Population (ZIP)
- 63,833
- Household income
- $102,761
- Rent vs Own
- Severe rent burden
- 1096.0
Population outlook (Riverside County) Hauer SSP2
- Today (2025)
- 2,664,475 people
- By 2030
- 2,802,692 · +5.2%
- By 2040
- 3,050,904 · +14.5%
- By 2050
- 3,256,783 · +22.2%
- By 2075
- 3,655,058 · +37.2%
- By 2100
- 3,766,594 · +41.4%
Race, ethnicity, and origin ACS 2023
- Neighborhood character
- Diverse neighborhood (Simpson 0.65)
- Race & ethnicity
- Hispanic / Latino 45% White 37% Two or more races 16% Black 8% Asian 7% Native American 1%
- Hispanic origin (detail)
- Mexican 40%
- Common ancestry
- Lithuanian 1% Romanian 1% Italian 1%
- Foreign-born
- 15% · Canada, China
- Languages at home
- 70% English-only · Spanish 23% Tagalog/Filipino 2% Chinese 1%
Political lean MEDSL · Riverside
- 2024 margin
- Toss-up / Even · D 48.0% · R 49.3% · Other 2.6%
- 2008→2024 swing
- -3.6pp toward R · 2008: 2.3pp · 2024: -1.3pp
- All cycles
- 2024: R+1.3 2020: D+8.0 2016: D+4.3 2012: R+0.4 2008: D+2.3
Not yet ingested
- Civics
- —
Market trends
- HPI YoY
- ▼ -395.13%
- Current HPI
- 373.4608
- Rent YoY
- ▲ 3.85%
- Metro
- Riverside-San Bernardino-Ontario, CA
- State GDP YoY
- ▲ 3.21%
- F500 in state
- 116
Industry mix (Fortune 500 HQ in CA)
| Industry | F500 HQs | Revenue |
|---|---|---|
| Technology | 27 | $1,492B |
|
||
| Financial Services | 3 | $174B |
|
||
| Retail | 3 | $44B |
|
||
| Insurance | 3 | $26B |
|
||
| Media / Entertainment | 2 | $115B |
|
||
| Pharmaceuticals / Biotech | 2 | $62B |
|
||
Price history
-6.7% since first listed2 events — show timeline
- 2026-02-12 Price Changed $11,995,000 CRMLS
- 2026-01-06 Listed $12,850,000 CRMLS
Cash-flow waterfall
monthlySold comps — $/sqft
last 12 mo · ≤1 miLoading sold comps…