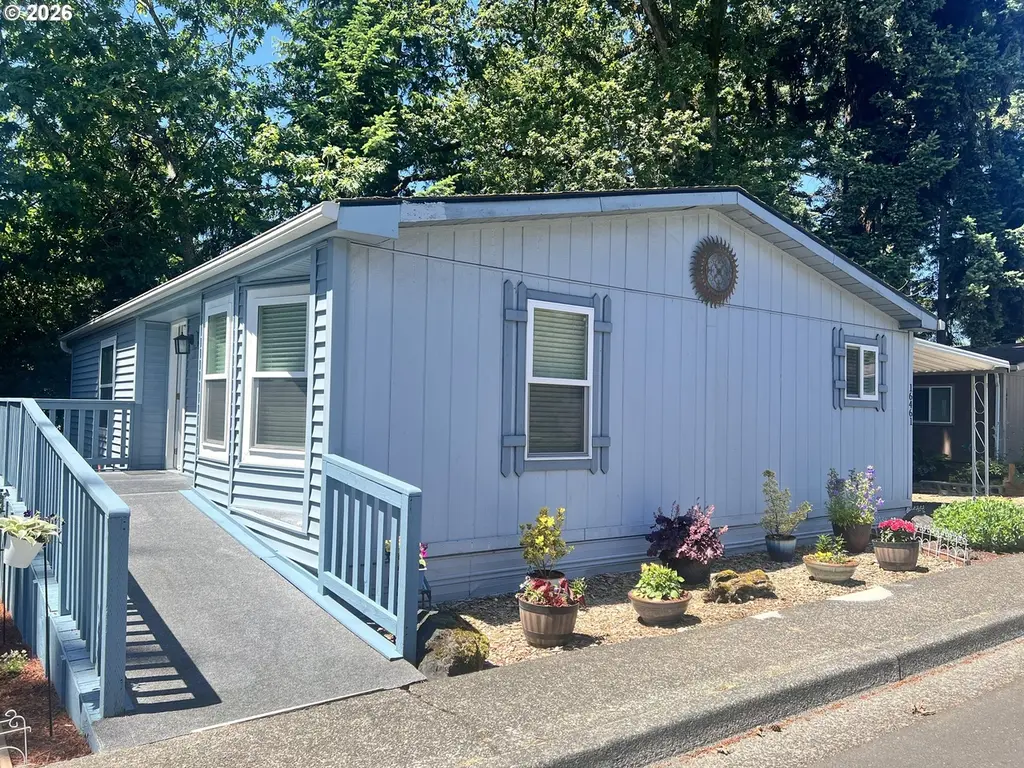
16461 SE Hearthwood Dr #52
Oatfield, OR 97015
$79,900B
2 bd · 1.0 ba ·
1,350 sqft ·
Built 1989
· Condo
· Active
· 2 DOM
Cashflow @ list (25.0% down · 7.5%)
Estimated rent
$1,891/mo
Mortgage (P&I)
−$419
Tax + insurance
−$95
HOA
−$0
Vac / Maint / Mgmt
−$397
Net cashflow
$980/mo
Annual
$11,757/yr
Cap rate
21.01%
Cash-on-cash
52.55%
DSCR
3.34
1% rule
2.37%
Cash to close
$22,372
Investor read
- This is a 2-bed/1.0-bath condo listed at $80k.
- At list price, monthly cash flow is $980 ($12k/yr) — positive.
- The deal already cash-flows at list — no discount required.
- Meets the 1% rule at list price ($2k rent vs $80k).
- Only 2 days on market — expect competitive offers; lowballing is unlikely to land.
- Local home prices are declining (-3.0%/yr); year-one equity from $552 of loan paydown is wiped out by about $2k of value loss. Plan a longer hold.
- Location reads 81/100 on livability (#49 in OR, #1,363 nationally) — a professional / high-income tenant draw. Strengths: commute A+, employment A+, housing A+; Watch: amenities D, cost of living F.
- North Clackamas SD 12 (suburban): math 29% / reading 43% proficiency, ranked #22 of 58 in OR (top 38%) — families likely to look elsewhere, expect single-tenant / working-renter base with shorter leases.
- Zoned schools: Clackamas High School (math 52% / reading 67%, grade C+, #23 of 143 statewide, top 19%, 1,224 students, 27% FRL).
- Zoned-school proficiency averages 60% at this address vs 36% district-wide (+24 pts) — the actual schools serving this property are materially stronger than the North Clackamas SD 12 average implies; a family-tenant draw the district grade alone would hide.
- Market conditions: Rents rising (+2.5%/yr); 124 active listings in the ZIP; 5 comparable units currently listed for rent nearby; rentals leasing fast (median 9d on market — plan ~1-2 weeks tenant-placement turnaround); solid renter incomes; 946 units permitted in Clackamas County in 2024 (188 in 5+ unit buildings).
- Clackamas County population projected at +25% by 2050 — long-run rental-demand tailwind backs the buy-and-hold thesis.
- 3 sale attempts since 5y ago with the ask held roughly flat each time — persistent listings suggest the price (not the market) is what's stuck; bring a comps-based counter.
- Current owner paid $55k; 45% above their basis — modest negotiation headroom, anchor on the comps not their cost.
- At projected returns (-3.0% appreciation + 2.5% rent growth), your $22k cash investment doubles in ~3 years — after that, you're playing with house money.
- Cap rate 21.0% vs local median 2.6% in Oatfield — top-decile yield for the area; either an underpriced asset or a hidden risk that comps aren't pricing in. Stress-test before assuming the spread holds.
Questions for listing agent
- Any open or pending special assessments — roof, HVAC, plumbing, elevator, façade? What's the per-unit balance and payoff schedule, and is the seller paying it off at close or rolling it to the buyer?
- Is there a deadline driving the sale (1031 exchange, divorce, estate, relocation)? That informs how much negotiation room exists.
- What's the average days-on-market for RENTAL listings here right now (not sales)? A rising rental-DOM trend means longer vacancies and softer asking-rent achievability than the comps imply.
- What's the recent tenant-quality profile in this submarket — average credit score on applications, eviction rate, late-payment / NSF rate, and stable-employment percentage? A property-management company in the area should have these aggregated.
- How much new apartment / multifamily construction is in the pipeline within 1–3 miles? Heavy new supply (>2% of stock underway) typically softens rents 12–24 months out; light construction supports rent growth.
CashFlowRE · CFR-S6SM5GE03306S0
· Data 2 weeks ago
cashflowre.app · 2026-05-29