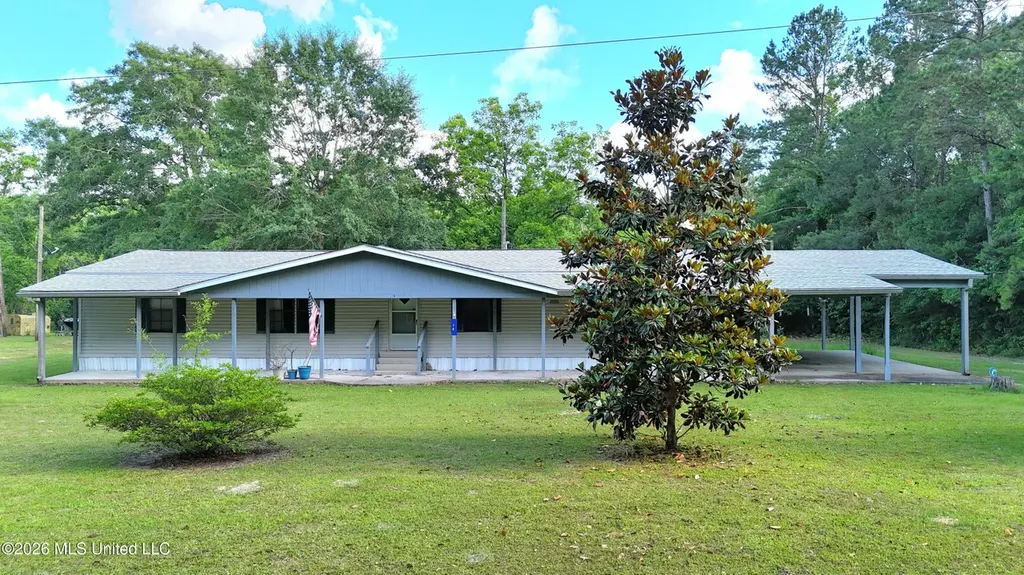
14 E Magnolia Ave
Saucier, MS 39561
$149,990D
3 bd · 2.5 ba ·
1,584 sqft ·
Built 1991
· Manufactured
· Pending
· 29 DOM
Cashflow @ list (25.0% down · 7.5%)
Estimated rent
$1,137/mo
Mortgage (P&I)
−$787
Tax + insurance
−$250
HOA
−$0
Vac / Maint / Mgmt
−$239
Net cashflow
$-138/mo
Annual
$-1,659/yr
Cap rate
5.19%
Cash-on-cash
-3.95%
DSCR
0.82
1% rule
0.76%
Cash to close
$41,997
Investor read
- This is a 3-bed/2.5-bath manufactured listed at $150k.
- At list price, monthly cash flow is $-138 ($-2k/yr) — negative.
- To cash-flow at today's rent, offer at most $130k (13.3% below list).
- To meet the 1% rule (rent ≥ 1% of price), the offer needs to be $114k (24.2% below list).
- It's been on market 29 days — a 2% lower offer ($148k) is reasonable based on typical stale-listing flexibility.
- Recommended offer: $114k (24.2% below list) — sets the bar for 1% rule.
- In year one you build about $9k of equity ($1k loan paydown + $8k appreciation (5.2% local appreciation)).
- Location reads 66/100 on livability (#91 in MS) — a middle-class / working-renter tenant base. Strengths: crime A+, cost of living A+; Watch: amenities F, commute F, health & safety F.
- Stone County School District (town): math 52% / reading 46% proficiency, ranked #15 of 130 in MS (top 12%) — families likely to look elsewhere, expect single-tenant / working-renter base with shorter leases.
- Zoned schools: Perkinston Elementary School (math 54% / reading 53%, grade C, #49 of 375 statewide, top 13%, 549 students, 100% FRL); Stone Middle School (math 54% / reading 42%, grade C-, #34 of 179 statewide, top 20%, 599 students, 100% FRL); Stone High School (math 52% / reading 42%, grade D-, #30 of 197 statewide, top 15%, 722 students, 100% FRL) — zoned schools average 100% FRL vs 56% district-wide (44 pts higher); higher-poverty schools than district average — tighter screening recommended.
- Market conditions: 37 active listings in the ZIP; 60 units permitted in Stone County in 2024 (0 in 5+ unit buildings).
- Stone County population projected to shrink 4% by 2050 — rents likely to lag national; underwrite the cash flow, not the appreciation.
- 2 sale attempts since 7y ago with the ask held roughly flat each time — persistent listings suggest the price (not the market) is what's stuck; bring a comps-based counter.
- By year 4, paydown + projected appreciation supports a ~$30k cash-out refi (75% LTV) — recoverable capital for the next deal without selling this one.
- Climate carrying-cost: severe wind risk, 99% chance of damaging wind over 30y; moderate wildfire risk; extreme-heat days projected 7→20/yr by 2055 (HVAC capex compounding) — expect insurance premiums to compound above CPI over the hold.
Questions for listing agent
- What do current leases actually rent for vs. the listed asking? Can we see a recent rent roll and the last 12 months of T-12 income?
- Is there a deadline driving the sale (1031 exchange, divorce, estate, relocation)? That informs how much negotiation room exists.
- The area grade is low — what's the realistic commute time and amenity access for the typical tenant pool here? Any planned neighborhood developments (good or bad) we should know about?
- What's the average days-on-market for RENTAL listings here right now (not sales)? A rising rental-DOM trend means longer vacancies and softer asking-rent achievability than the comps imply.
- What's the recent tenant-quality profile in this submarket — average credit score on applications, eviction rate, late-payment / NSF rate, and stable-employment percentage? A property-management company in the area should have these aggregated.
- How much new for-sale + rental construction is in the pipeline within 1–3 miles? Heavy new supply typically softens prices + rents 12–24 months out; constrained supply supports both.
CashFlowRE · CFR-S7GPVJ82A613TC
· Data 3 days ago
cashflowre.app · 2026-05-29