14 E Magnolia Ave · Saucier, MS
Flood risk 1/10 · Minimal
- FEMA flood zone
- X (unshaded)
- Chance of flooding over 30 yrs
- 0.0%
- Est. flood insurance / yr
- $507 – $1,088
Fire risk 5/10 · Moderate
- Est. fire insurance / yr
- $1,241 – $2,305
Heat risk 8/10 · Major
- Hot days now (above 108°F)
- 7 days/yr
- Hot days in 30 yrs
- 20 days/yr
Wind risk 9/10 · Severe
- Chance of severe wind over 30 yrs
- 99.0%
Air-quality risk 1/10 · Minimal
- Unhealthy air days now
- 0 days/yr
- Unhealthy air days in 30 yrs
- 0 days/yr
Risk factors via First Street. Map © Google.
Why this score? — see what drove the D grade
The composite is a weighted blend of 9 inputs, each scored 0–100. Each bar is that input's sub-score; the figure is the points it added to the 100-point composite (weight × sub-score).
- Cash flow +8.3/30.0
- Appreciation +7.6/10.0
- ARV discount +7.5/15.0
- Schools +4.1/10.0
- Livability +3.3/5.0
- 1% rule +2.6/10.0
- Rent growth +2.5/5.0
- Condition / age +2.5/5.0
- DSCR +2.2/10.0
$149,990
🖨 Deal sheet 📄 Offer letter ✓ Due diligence
Listing remarks
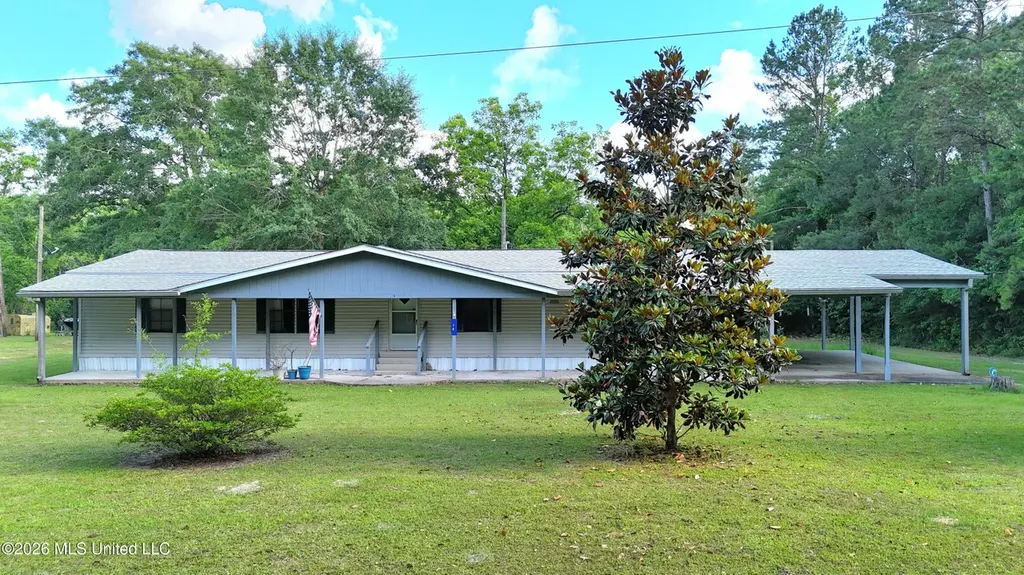
Spacious and private 3BR/2.5BA double wide situated on 3/4 of an acre (two lots) with two living spaces, a fireplace, and lots of storage throughout. The primary suite has a soaking tub with separate stand-up shower. Covered back patio, big covered carport, and a large powered shop. New roof, community water, and private septic.
Key facts
- Two living spaces
- Double wide
- Soaking tub
Tags
Property features AI
Exterior
- Parking: Carport (2 spaces)
- Utilities: Septic tank; Community water; Electricity connected; Sewer connected; Water connected
- Home design: Manufactured home / mobile home; Single-story
- Construction: Siding exterior; Pilings/steel/wood foundation; Shingle roof; Built (year from public records)
- Exterior features: Porch; Rain gutters; Workshop; Lot is cleared with few trees
Interior
- Kitchen: Dishwasher; Oven; Refrigerator
- Flooring: Carpet; Vinyl
- Bathrooms: 2 full bathrooms; 1 half bathroom (3 total)
- Heating & cooling: Central heating (electric, heat pump); Central air conditioning (electric)
- Interior features: Ceiling fans; Soaking tub; Kitchen island; Fireplace in living room
- Laundry & utility: Laundry room; Washer; Dryer
Neighborhood map
What this means for you Summary
Snapshot
- This is a 3-bed/2.5-bath manufactured listed at $150k.
Deal economics
- At list price, monthly cash flow is $-138 ($-2k/yr) — negative.
- To cash-flow at today's rent, offer at most $130k (13.3% below list).
- To meet the 1% rule (rent ≥ 1% of price), the offer needs to be $114k (24.2% below list).
- Recommended offer: $114k (24.2% below list) — sets the bar for 1% rule.
Location & tenants
- Location reads 66/100 on livability (#91 in MS) — a middle-class / working-renter tenant base. Strengths: crime A+, cost of living A+; Watch: amenities F, commute F, health & safety F.
- Stone County School District (town): math 52% / reading 46% proficiency, ranked #15 of 130 in MS (top 12%) — families likely to look elsewhere, expect single-tenant / working-renter base with shorter leases.
- Zoned schools: Perkinston Elementary School (math 54% / reading 53%, grade C, #49 of 375 statewide, top 13%, 549 students, 100% FRL); Stone Middle School (math 54% / reading 42%, grade C-, #34 of 179 statewide, top 20%, 599 students, 100% FRL); Stone High School (math 52% / reading 42%, grade D-, #30 of 197 statewide, top 15%, 722 students, 100% FRL) — zoned schools average 100% FRL vs 56% district-wide (44 pts higher); higher-poverty schools than district average — tighter screening recommended.
- Market conditions: 37 active listings in the ZIP; 60 units permitted in Stone County in 2024 (0 in 5+ unit buildings).
Forward outlook
- In year one you build about $9k of equity ($1k loan paydown + $8k appreciation (5.2% local appreciation)).
- Stone County population projected to shrink 4% by 2050 — rents likely to lag national; underwrite the cash flow, not the appreciation.
- By year 4, paydown + projected appreciation supports a ~$30k cash-out refi (75% LTV) — recoverable capital for the next deal without selling this one.
Negotiation context
- It's been on market 29 days — a 2% lower offer ($148k) is reasonable based on typical stale-listing flexibility.
- 2 sale attempts since 7y ago with the ask held roughly flat each time — persistent listings suggest the price (not the market) is what's stuck; bring a comps-based counter.
Risks & watch-outs
- Climate carrying-cost: severe wind risk, 99% chance of damaging wind over 30y; moderate wildfire risk; extreme-heat days projected 7→20/yr by 2055 (HVAC capex compounding) — expect insurance premiums to compound above CPI over the hold.
Questions for the listing agent
- What do current leases actually rent for vs. the listed asking? Can we see a recent rent roll and the last 12 months of T-12 income?
- Is there a deadline driving the sale (1031 exchange, divorce, estate, relocation)? That informs how much negotiation room exists.
- The area grade is low — what's the realistic commute time and amenity access for the typical tenant pool here? Any planned neighborhood developments (good or bad) we should know about?
- What's the average days-on-market for RENTAL listings here right now (not sales)? A rising rental-DOM trend means longer vacancies and softer asking-rent achievability than the comps imply.
- What's the recent tenant-quality profile in this submarket — average credit score on applications, eviction rate, late-payment / NSF rate, and stable-employment percentage? A property-management company in the area should have these aggregated.
- How much new for-sale + rental construction is in the pipeline within 1–3 miles? Heavy new supply typically softens prices + rents 12–24 months out; constrained supply supports both.
Investment metrics
- 1% rule
- 0.76% ✗
- Cap rate
- 5.19%
- Cash-on-cash
- -3.95%
- DSCR
- 0.82
- GRM
- 11.0
CMA / ARV
No comps found within radius.
Projected returns pro-forma
5.23% appreciation · 3.0% rent growth · sell at horizon
- IRR
- 10.2%
- Equity multiple
- 1.66×
- Total profit
- $27,781
- Equity at exit
- $87,124
- IRR
- 11.6%
- Equity multiple
- 3.16×
- Total profit
- $90,747
- Equity at exit
- $152,151
Cash invested: $41,997 (down + closing). Projections, not guarantees.
Landlord ↔ Tenant lean methodology
- Overall (STATE)
- 90 Strongly Landlord-Friendly
- State Mississippi
- 90 Strongly Landlord-Friendly · R+11
- County
- — inherits STATE
- City
- — inherits STATE
ZIP-level market 39561
- Home prices YoY
- 3.0%
- Active inventory
- 37
- Price-to-rent
- 11.0×
Monthly cashflow live
- Estimated rent
- $1,137 medium interval (Pro) →
- Mortgage (P&I)
- −$787
- Tax est. 1.5%
- −$187 /mo · $2,250/yr
- Insurance
- −$62
- HOA
- −$0
- Vacancy / Maint / Mgmt
- −$239
- Net cashflow
- $-138
Break-even live
UW: 25.0% down · 7.5% · 30yr · 1.5% tax · 5.0% vac · 8.0% maint · 8.0% mgmt
Financing live
Cash to close
- Down payment
- $37,498
- Closing costs
- $4,500
- Reserves months
- —
- Total cash needed
- —
Loan-product check · same deal, 3 products live
Conventional
25% down · 7.5% · 30yr
- Down + closing
- —
- Monthly P&I
- —
- Monthly cashflow
- —
- DSCR
- —
- Eligible?
- —
Personal DTI + credit; lowest rate.
DSCR
20% down · 8.5% · 30yr
- Down + closing
- —
- Monthly P&I
- —
- Monthly cashflow
- —
- DSCR
- —
- Eligible?
- —
No personal income docs; deal must DSCR.
Hard money
10% down · 12.0% · 12mo
- Down + closing
- —
- Monthly P&I
- —
- Monthly cashflow
- —
- DSCR
- —
- Eligible?
- —
Short-term bridge; refi at stabilization.
Listing history 16 events
-
2026-06-17statusdays on market $149,990 Pending 29 DOM
-
2026-06-16days on market $149,990 Active 28 DOM
-
2026-06-15days on market $149,990 Active 27 DOM
-
2026-06-13days on market $149,990 Active 25 DOM
-
2026-06-12days on market $149,990 Active 24 DOM
-
2026-06-09days on market $149,990 Active 21 DOM
-
2026-06-08days on market $149,990 Active 20 DOM
-
2026-06-07days on market $149,990 Active 19 DOM
-
2026-06-07days on market $149,990 Active 18 DOM
-
2026-06-04days on market $149,990 Active 15 DOM
-
2026-06-02days on market $149,990 Active 14 DOM
-
2026-06-01days on market $149,990 Active 13 DOM
-
2026-05-31days on market $149,990 Active 12 DOM
-
2026-05-19$149,990 Active
-
2021-10-01historical
-
2019-04-01$95,000
ⓘ Source: listings_history table (triggers on properties + properties_extension) + one-shot
backfill from property_details.listing_events for pre-trigger history.
Climate risk First Street
- Flood 1/10 Low FEMA zone X (unshaded) · 0% chance over 30 yrs
- Wildfire 5/10 Major
- Heat 8/10 Severe 7 d/yr ≥108°F today · 20 d/yr by 30 yrs out
- Wind 9/10 Extreme 99% chance of damaging wind over 30 yrs
- Air quality 1/10 Low 0 unhealthy d/yr today · 0 by 30 yrs out
Nearby sold comps map
Loading sold comps map…
Walkable amenities ~0.75 mi
Loading nearby amenities…
Taxation est. · year 1
- Rental income
- $13,645
- − Mortgage interest
- −$8,402
- − Property taxes
- −$2,250
- − Insurance
- −$750
- − Repairs & maintenance
- −$1,092
- − Management
- −$1,092
- − Depreciation
- −$4,363
- Taxable loss
- −$4,303
- Est. tax savings @ 24.0%
- +$1,033
- After-tax cash flow
- $-626/yr
For passive investors: Depreciation is non-cash, so a rental often shows a tax loss while cash-flowing — sheltering income. Rental losses are passive: they offset passive income freely, and up to $25,000/yr can offset ordinary (W-2) income if you actively participate and your MAGI is under $100k (phasing out to $0 by $150k); unused losses carry forward. On sale, claimed depreciation is recaptured at up to 25%, and gains may owe capital-gains tax (a 1031 exchange can defer both). Figures are a year-1 estimate at your 24.0% rate — not tax advice; consult a CPA.
Schools (NCES district)
- District
- Stone County School District
- NCES district ID
- 2804170
- Math proficiency
- 52% ▼ -8.00%
- Reading proficiency
- 46% ▼ -7.00%
- Median HH income
- $43,785
- Composite
- 41.4/100
- National rank
- #3476
- State rank
- #15 of 130 in MS
Livability — Saucier
- Score
- 66/100
- State rank
- #91
- US rank
- #11386
Category grades
Schools grade is shown separately in the Schools card above.
Census & demographics
- Population (ZIP)
- 2,224
Population outlook (Stone County) Hauer SSP2
- Today (2025)
- 18,528 people
- By 2030
- 18,585 · +0.3%
- By 2040
- 18,429 · -0.5%
- By 2050
- 17,825 · -3.8%
- By 2075
- 16,095 · -13.1%
- By 2100
- 14,276 · -22.9%
Race, ethnicity, and origin ACS 2023
- Neighborhood character
- Predominantly White (94%)
- Race & ethnicity
- White 94% Two or more races 6%
- Common ancestry
- Serbian 4% Slovak 2% Lithuanian 1%
- Foreign-born
- 1% · Canada
Political lean MEDSL · Stone
- 2024 margin
- Solid R (+58.0) · D 20.5% · R 78.5% · Other 1.1%
- 2008→2024 swing
- -14.5pp toward R · 2008: -43.5pp · 2024: -58.0pp
- All cycles
- 2024: R+58.0 2020: R+52.8 2016: R+53.5 2012: R+45.9 2008: R+43.5
Not yet ingested
- Civics
- —
Market trends
- HPI YoY
- ▲ 5.23%
- Current HPI
- 182.594
- Rent YoY
- —
- Metro
- —
- State GDP YoY
- —
- F500 in state
- 0
Price history
+57.9% since first listed3 events — show timeline
- 2026-05-19 Listed $149,990 MLSU
- 2021-10-01 Listing Removed — MLSU
- 2019-04-01 Listed $95,000 MLSU
Cash-flow waterfall
monthlySold comps — $/sqft
last 12 mo · ≤1 miLoading sold comps…