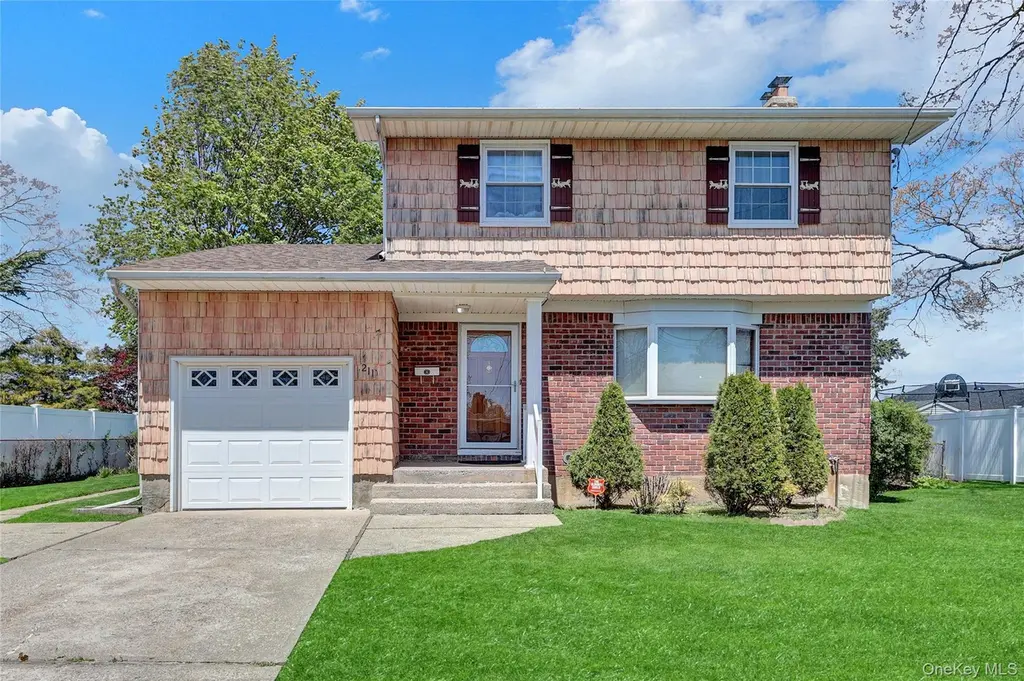
211 Lynbrook St
Islip Terrace, NY 11752
$579,999D
3 bd · 1.5 ba ·
1,787 sqft ·
Built 1954
· SingleFamily
· Pending
· 9 DOM
Cashflow @ list (25.0% down · 7.5%)
Estimated rent
$3,971/mo
Mortgage (P&I)
−$3,042
Tax + insurance
−$835
HOA
−$0
Vac / Maint / Mgmt
−$834
Net cashflow
$-739/mo
Annual
$-8,869/yr
Cap rate
4.76%
Cash-on-cash
-5.46%
DSCR
0.76
1% rule
0.68%
Cash to close
$162,400
Investor read
- This is a 3-bed/1.5-bath single-family listed at $580k.
- At list price, monthly cash flow is $-739 ($-9k/yr) — negative.
- To cash-flow at today's rent, offer at most $449k (22.5% below list).
- To meet the 1% rule (rent ≥ 1% of price), the offer needs to be $397k (31.5% below list).
- Only 9 days on market — expect competitive offers; lowballing is unlikely to land.
- Recommended offer: $397k (31.5% below list) — sets the bar for 1% rule.
- Local home prices are declining (-3.0%/yr); year-one equity from $4k of loan paydown is wiped out by about $17k of value loss. Plan a longer hold.
- Location reads 84/100 on livability (#49 in NY, #770 nationally) — a professional / high-income tenant draw. Strengths: commute A+, employment A+, housing A+; Watch: amenities F, cost of living F.
- East Islip Union Free School District (suburban): math 68% / reading 69% proficiency, ranked #110 of 590 in NY (top 19%) — acceptable for families but not a draw, mixed tenant base, ~2y average lease; only 12% free/reduced lunch — higher-income household profile.
- Zoned schools: Connetquot Elementary School (366 students, 36% FRL); East Islip Middle School (math 50% / reading 67%, grade B, #178 of 729 statewide, top 25%, 804 students, 22% FRL); East Islip High School (math 96% / reading 98%, grade A+, #53 of 1,100 statewide, top 5%, 1,145 students, 25% FRL) — zoned schools average 28% FRL vs 12% district-wide (16 pts higher); higher-poverty schools than district average — tighter screening recommended.
- Watch-outs: built in 1954 — expect roof / HVAC / electrical / plumbing capex.
- Market conditions: 35 active listings in the ZIP; 2 comparable units currently listed for rent nearby; 1,366 units permitted in Suffolk County in 2024 (216 in 5+ unit buildings).
- Suffolk County population projected to shrink 5% by 2050 — rents likely to lag national; underwrite the cash flow, not the appreciation.
- Climate carrying-cost: major wind risk, 69% chance of damaging wind over 30y; extreme-heat days projected 7→17/yr by 2055 (HVAC capex compounding) — expect insurance premiums to compound above CPI over the hold.
Questions for listing agent
- What do current leases actually rent for vs. the listed asking? Can we see a recent rent roll and the last 12 months of T-12 income?
- Built in 1954 — when were the roof, HVAC, electrical panel, plumbing, and water heater last replaced?
- Is there a deadline driving the sale (1031 exchange, divorce, estate, relocation)? That informs how much negotiation room exists.
- Schools are A-rated — typically a magnet for longer-tenancy family renters. What's the average tenant stay here, and is there a school-zone premium baked into asking?
- The area grade is low — what's the realistic commute time and amenity access for the typical tenant pool here? Any planned neighborhood developments (good or bad) we should know about?
- What's the average days-on-market for RENTAL listings here right now (not sales)? A rising rental-DOM trend means longer vacancies and softer asking-rent achievability than the comps imply.
- What's the recent tenant-quality profile in this submarket — average credit score on applications, eviction rate, late-payment / NSF rate, and stable-employment percentage? A property-management company in the area should have these aggregated.
- How much new for-sale + rental construction is in the pipeline within 1–3 miles? Heavy new supply typically softens prices + rents 12–24 months out; constrained supply supports both.
CashFlowRE · CFR-S7WQT7CBZR02G5
· Data 2 weeks ago
cashflowre.app · 2026-05-29