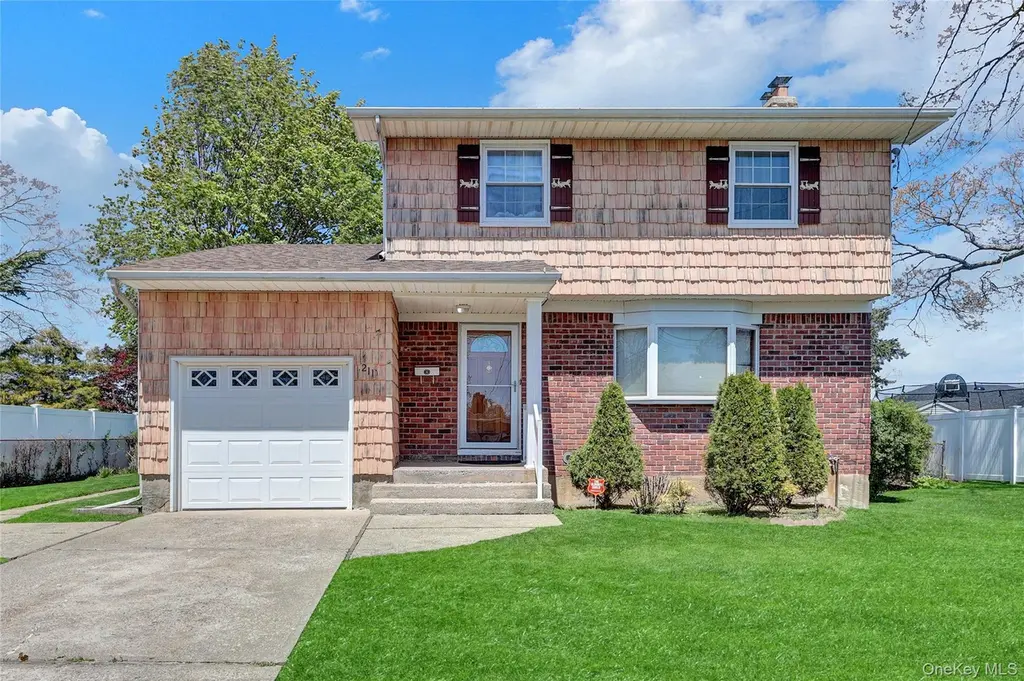
211 Lynbrook St · Islip Terrace, NY
Flood risk 1/10 · Minimal
- FEMA flood zone
- X (unshaded)
- Chance of flooding over 30 yrs
- 0.0%
- Est. flood insurance / yr
- $473 – $860
Fire risk 2/10 · Minimal
- Est. fire insurance / yr
- $691 – $1,283
Heat risk 5/10 · Moderate
- Hot days now (above 94°F)
- 7 days/yr
- Hot days in 30 yrs
- 17 days/yr
Wind risk 6/10 · Moderate
- Chance of severe wind over 30 yrs
- 69.0%
Air-quality risk 4/10 · Minor
- Unhealthy air days now
- 3 days/yr
- Unhealthy air days in 30 yrs
- 5 days/yr
Risk factors via First Street. Map © Google.
Why this score? — see what drove the D grade
The composite is a weighted blend of 9 inputs, each scored 0–100. Each bar is that input's sub-score; the figure is the points it added to the 100-point composite (weight × sub-score).
- ARV discount +15.0/15.0
- Cash flow +7.4/30.0
- Schools +6.3/10.0
- Livability +4.2/5.0
- Rent growth +2.5/5.0
- Condition / age +2.5/5.0
- 1% rule +1.8/10.0
- DSCR +1.6/10.0
- Appreciation +0.0/10.0
$579,999
🖨 Deal sheet 📄 Offer letter ✓ Due diligence
Listing remarks
Welcome to 211 Lynbrook- This classic Colonial is situated mid-block right in the heart of Islip Terrace. This property features 3 Beds and 1.5 baths. On the First floor you’ll be invited into a comforting living room that features a wood burning fireplace and hardwood floors. The first floor also features a formal dining room, kitchen and family room for entertaining and relaxation. On the second floor you’ll enjoy 3 bedrooms including a primary bedroom that has direct access to the full bathroom. Outside you will enjoy a spacious open yard with endless possibilities. This property has all the potential needed to become your dream home!
Key facts
- Formal dining room
- Spacious open yard
- Hardwood floors
Tags
Property features AI
Exterior
- Parking: Carport; Driveway; Detached garage (1 garage space)
- Utilities: Cesspool sewer; Water available and connected; Natural gas connected; Electricity available; Cable available; Phone connected
- Home design: Single family residence
- Construction: Frame construction
- Exterior features: Frame construction; Back yard; Landscaped lot; Level lot; Front and rear sprinkler system; Not waterfront
Interior
- Kitchen: Convection oven; Gas oven; Refrigerator
- Bedrooms: 9 total rooms (includes bedrooms and living spaces)
- Flooring: Hardwood floors
- Bathrooms: 1 full bathroom; 1 half bathroom
- Heating & cooling: Forced air heating; No central air
- Interior features: First-floor full bath; Eat-in kitchen; Formal dining room; Finished full basement with storage space; Full attic
- Laundry & utility: Washer in unit; Laundry located in basement; Gas water heater
Neighborhood map
What this means for you Summary
Snapshot
- This is a 3-bed/1.5-bath single-family listed at $580k.
Deal economics
- At list price, monthly cash flow is $-739 ($-9k/yr) — negative.
- To cash-flow at today's rent, offer at most $449k (22.5% below list).
- To meet the 1% rule (rent ≥ 1% of price), the offer needs to be $397k (31.5% below list).
- Recommended offer: $397k (31.5% below list) — sets the bar for 1% rule.
Location & tenants
- Location reads 84/100 on livability (#49 in NY, #770 nationally) — a professional / high-income tenant draw. Strengths: commute A+, employment A+, housing A+; Watch: amenities F, cost of living F.
- East Islip Union Free School District (suburban): math 68% / reading 69% proficiency, ranked #110 of 590 in NY (top 19%) — acceptable for families but not a draw, mixed tenant base, ~2y average lease; only 12% free/reduced lunch — higher-income household profile.
- Zoned schools: Connetquot Elementary School (366 students, 36% FRL); East Islip Middle School (math 50% / reading 67%, grade B, #178 of 729 statewide, top 25%, 804 students, 22% FRL); East Islip High School (math 96% / reading 98%, grade A+, #53 of 1,100 statewide, top 5%, 1,145 students, 25% FRL) — zoned schools average 28% FRL vs 12% district-wide (16 pts higher); higher-poverty schools than district average — tighter screening recommended.
- Market conditions: 35 active listings in the ZIP; 2 comparable units currently listed for rent nearby; 1,366 units permitted in Suffolk County in 2024 (216 in 5+ unit buildings).
Forward outlook
- Local home prices are declining (-3.0%/yr); year-one equity from $4k of loan paydown is wiped out by about $17k of value loss. Plan a longer hold.
- Suffolk County population projected to shrink 5% by 2050 — rents likely to lag national; underwrite the cash flow, not the appreciation.
Negotiation context
- Only 9 days on market — expect competitive offers; lowballing is unlikely to land.
Risks & watch-outs
- Watch-outs: built in 1954 — expect roof / HVAC / electrical / plumbing capex.
- Climate carrying-cost: major wind risk, 69% chance of damaging wind over 30y; extreme-heat days projected 7→17/yr by 2055 (HVAC capex compounding) — expect insurance premiums to compound above CPI over the hold.
Questions for the listing agent
- What do current leases actually rent for vs. the listed asking? Can we see a recent rent roll and the last 12 months of T-12 income?
- Built in 1954 — when were the roof, HVAC, electrical panel, plumbing, and water heater last replaced?
- Is there a deadline driving the sale (1031 exchange, divorce, estate, relocation)? That informs how much negotiation room exists.
- Schools are A-rated — typically a magnet for longer-tenancy family renters. What's the average tenant stay here, and is there a school-zone premium baked into asking?
- The area grade is low — what's the realistic commute time and amenity access for the typical tenant pool here? Any planned neighborhood developments (good or bad) we should know about?
- What's the average days-on-market for RENTAL listings here right now (not sales)? A rising rental-DOM trend means longer vacancies and softer asking-rent achievability than the comps imply.
- What's the recent tenant-quality profile in this submarket — average credit score on applications, eviction rate, late-payment / NSF rate, and stable-employment percentage? A property-management company in the area should have these aggregated.
- How much new for-sale + rental construction is in the pipeline within 1–3 miles? Heavy new supply typically softens prices + rents 12–24 months out; constrained supply supports both.
Investment metrics
- 1% rule
- 0.68% ✗
- Cap rate
- 4.76%
- Cash-on-cash
- -5.46%
- DSCR
- 0.76
- GRM
- 12.2
CMA / ARV
- ARV (median comp)
- $741,494
- List price
- $579,999
- Delta
- -21.78%
- Verdict
- UNDERPRICED
- Comps
- 20 within 1.0 mi
Show comp detail 12 sales within ~0.75 mi
| Address | Dist | Beds/Ba | Sqft | Sold | Price | $/sf | Match |
|---|---|---|---|---|---|---|---|
| 317 Garden City St | 0.18mi | 4/2.0 (+1) | 1,670 (-6%) | 0mo | $690,000 | $413 | 73 |
| 31 Craig Rd | 0.33mi | 4/1.5 (+1) | 1,690 (-5%) | 5mo | $735,000 | $435 | 66 |
| 407 Elmwood St | 0.22mi | 3/2.0 | 1,628 (-9%) | 10mo | $585,000 | $359 | 64 |
| 527 Connetquot Ave | 0.21mi | 3/2.0 | 1,700 (-5%) | 19mo | $615,000 | $362 | 64 |
| 35 Satellite Dr | 0.25mi | 4/2.0 (+1) | 1,702 (-5%) | 12mo | $715,000 | $420 | 64 |
| 334 Garden City St | 0.15mi | 4/2.0 (+1) | 2,000 (+12%) | 15mo | $640,000 | $320 | 54 |
| 11 Rolan Ct | 0.43mi | 3/1.5 | 1,530 (-14%) | 5mo | $620,000 | $405 | 52 |
| 81 Andrew Ave | 0.72mi | 4/2.0 (+1) | 1,800 (+1%) | 10mo | $700,000 | $389 | 50 |
| 80 Andrew Ave | 0.70mi | 4/2.0 (+1) | 1,710 (-4%) | 4mo | $675,000 | $395 | 49 |
| 6 Robinhood Dr | 0.68mi | 4/2.0 (+1) | 1,874 (+5%) | 9mo | $780,000 | $416 | 46 |
| 63 Sherwood Dr | 0.59mi | 3/2.0 | 1,530 (-14%) | 6mo | $719,100 | $470 | 42 |
| 133 Adams St E | 0.72mi | 3/2.0 | 1,600 (-10%) | 10mo | $724,000 | $453 | 39 |
Match score weights: distance 35% · size 25% · config 20% · recency 20%. Top-matched comps best support the ARV.
Projected returns pro-forma
-3.0% appreciation · 3.0% rent growth · sell at horizon
- IRR
- -25.6%
- Equity multiple
- 0.13×
- Total profit
- $-141,078
- Equity at exit
- $86,480
- IRR
- -22.1%
- Equity multiple
- -0.13×
- Total profit
- $-183,546
- Equity at exit
- $50,148
Cash invested: $162,400 (down + closing). Projections, not guarantees.
Landlord ↔ Tenant lean methodology
- Overall (STATE)
- 15 Strongly Tenant-Friendly
- State New York
- 15 Strongly Tenant-Friendly · D+10
- County
- — inherits STATE
- City
- — inherits STATE
ZIP-level market 11752
- Active inventory
- 35
- Price-to-rent
- 12.2×
Monthly cashflow live
- Estimated rent
- $3,971 medium interval (Pro) →
- Mortgage (P&I)
- −$3,042
- Tax from tax record
- −$593 /mo · $7,119/yr
- Insurance
- −$242
- HOA
- −$0
- Vacancy / Maint / Mgmt
- −$834
- Net cashflow
- $-739
Break-even live
UW: 25.0% down · 7.5% · 30yr · 1.5% tax · 5.0% vac · 8.0% maint · 8.0% mgmt
Financing live
Cash to close
- Down payment
- $145,000
- Closing costs
- $17,400
- Reserves months
- —
- Total cash needed
- —
Loan-product check · same deal, 3 products live
Conventional
25% down · 7.5% · 30yr
- Down + closing
- —
- Monthly P&I
- —
- Monthly cashflow
- —
- DSCR
- —
- Eligible?
- —
Personal DTI + credit; lowest rate.
DSCR
20% down · 8.5% · 30yr
- Down + closing
- —
- Monthly P&I
- —
- Monthly cashflow
- —
- DSCR
- —
- Eligible?
- —
No personal income docs; deal must DSCR.
Hard money
10% down · 12.0% · 12mo
- Down + closing
- —
- Monthly P&I
- —
- Monthly cashflow
- —
- DSCR
- —
- Eligible?
- —
Short-term bridge; refi at stabilization.
Rent comps 2 comps
| Address | Beds | Baths | Sqft | Rent | $/sqft | DOM | Units | Dist |
|---|---|---|---|---|---|---|---|---|
| 8587 Washington St East Islip, NY | 3.0 | 1.5 | 2555 | $3,900 | $1.53 | 1d | 1 | 0.89mi |
| 725 Eastview Dr Central Islip, NY | 2.0 | 2.0 | 1467 | $4,050 | $2.76 | 1d | 3 | 1.15mi |
Listing history 2 events
-
2026-06-07statusdays on market $579,999 Pending 9 DOM
-
2026-05-12$579,999 Active 663-char remark
ⓘ Source: listings_history table (triggers on properties + properties_extension) + one-shot
backfill from property_details.listing_events for pre-trigger history.
Tax reassessment forecast NY · Partial reset (capped growth)
- Current annual tax
- $7,119 · $593/mo
- Projected year-2 tax
- $8,461 · $705/mo
- Expected delta
- +$1,341/yr (+$112/mo · 18.8%)
ⓘ Screening estimate from a state-policy table — verify with the county assessor before closing.
Climate risk First Street
- Flood 1/10 Low FEMA zone X (unshaded) · 0% chance over 30 yrs
- Wildfire 2/10 Low
- Heat 5/10 Major 7 d/yr ≥94°F today · 17 d/yr by 30 yrs out
- Wind 6/10 Major 69% chance of damaging wind over 30 yrs
- Air quality 4/10 Moderate 3 unhealthy d/yr today · 5 by 30 yrs out
Nearby sold comps map
Loading sold comps map…
Walkable amenities ~0.75 mi
Loading nearby amenities…
Taxation est. · year 1
- Rental income
- $47,657
- − Mortgage interest
- −$32,489
- − Property taxes
- −$7,119
- − Insurance
- −$2,900
- − Repairs & maintenance
- −$3,813
- − Management
- −$3,813
- − Depreciation
- −$16,873
- Taxable loss
- −$19,349
- Est. tax savings @ 24.0%
- +$4,644
- After-tax cash flow
- $-4,225/yr
For passive investors: Depreciation is non-cash, so a rental often shows a tax loss while cash-flowing — sheltering income. Rental losses are passive: they offset passive income freely, and up to $25,000/yr can offset ordinary (W-2) income if you actively participate and your MAGI is under $100k (phasing out to $0 by $150k); unused losses carry forward. On sale, claimed depreciation is recaptured at up to 25%, and gains may owe capital-gains tax (a 1031 exchange can defer both). Figures are a year-1 estimate at your 24.0% rate — not tax advice; consult a CPA.
Schools (NCES district)
- District
- East Islip Union Free School District
- NCES district ID
- 3609720
- Math proficiency
- 68% ▼ -4.00%
- Reading proficiency
- 69% ▲ 3.00%
- Median HH income
- $102,520
- Composite
- 63.15/100
- National rank
- #641
- State rank
- #110 of 590 in NY
Livability — Islip Terrace
- Score
- 84/100
- State rank
- #49
- US rank
- #770
Category grades
Schools grade is shown separately in the Schools card above.
Census & demographics
- Census place
- Islip Terrace, NY
- Population (ZIP)
- 8,990
Population outlook (Suffolk County) Hauer SSP2
- Today (2025)
- 1,505,262 people
- By 2030
- 1,498,318 · -0.5%
- By 2040
- 1,471,101 · -2.3%
- By 2050
- 1,424,848 · -5.3%
- By 2075
- 1,337,157 · -11.2%
- By 2100
- 1,217,720 · -19.1%
Race, ethnicity, and origin ACS 2023
- Neighborhood character
- Predominantly White (72%)
- Race & ethnicity
- White 72% Hispanic / Latino 20% Two or more races 14% Black 1% Asian 1%
- Hispanic origin (detail)
- Mexican 2% Puerto Rican 6% Dominican 2%
- Common ancestry
- Romanian 4% Scotch-Irish 1% Russian 1%
- Foreign-born
- 13% · Canada
- Languages at home
- 83% English-only · Spanish 14% Other Indo-European 2% German/W. Germanic 1%
Political lean MEDSL · Suffolk
- 2024 margin
- Lean R (+10.0) · D 45.0% · R 55.0%
- 2008→2024 swing
- -16.0pp toward R · 2008: 6.0pp · 2024: -10.0pp
- All cycles
- 2024: R+10.0 2020: R+0.0 2016: R+8.2 2012: D+2.9 2008: D+6.0
Not yet ingested
- Civics
- —
Market trends
- HPI YoY
- ▼ -379.24%
- Current HPI
- 338.5558
- Rent YoY
- —
- Metro
- —
- State GDP YoY
- ▲ 2.60%
- F500 in state
- 92
Industry mix (Fortune 500 HQ in NY)
| Industry | F500 HQs | Revenue |
|---|---|---|
| Financial Services | 10 | $950B |
|
||
| Consumer Goods | 9 | $162B |
|
||
| Insurance | 4 | $225B |
|
||
| Telecommunications | 2 | $144B |
|
||
| Pharmaceuticals | 2 | $112B |
|
||
| Media / Entertainment | 2 | $69B |
|
||
Price history
2 events — show timeline
- 2026-06-04 Pending — OneKey® MLS as Distributed by MLS Grid
- 2026-05-12 Listed $579,999 OneKey® MLS as Distributed by MLS Grid
Property tax history
+0.7%/yrLatest (2017): $7,119 · -0.3% YoY. Source: county tax records.
Cash-flow waterfall
monthlySold comps — $/sqft
last 12 mo · ≤1 miLoading sold comps…