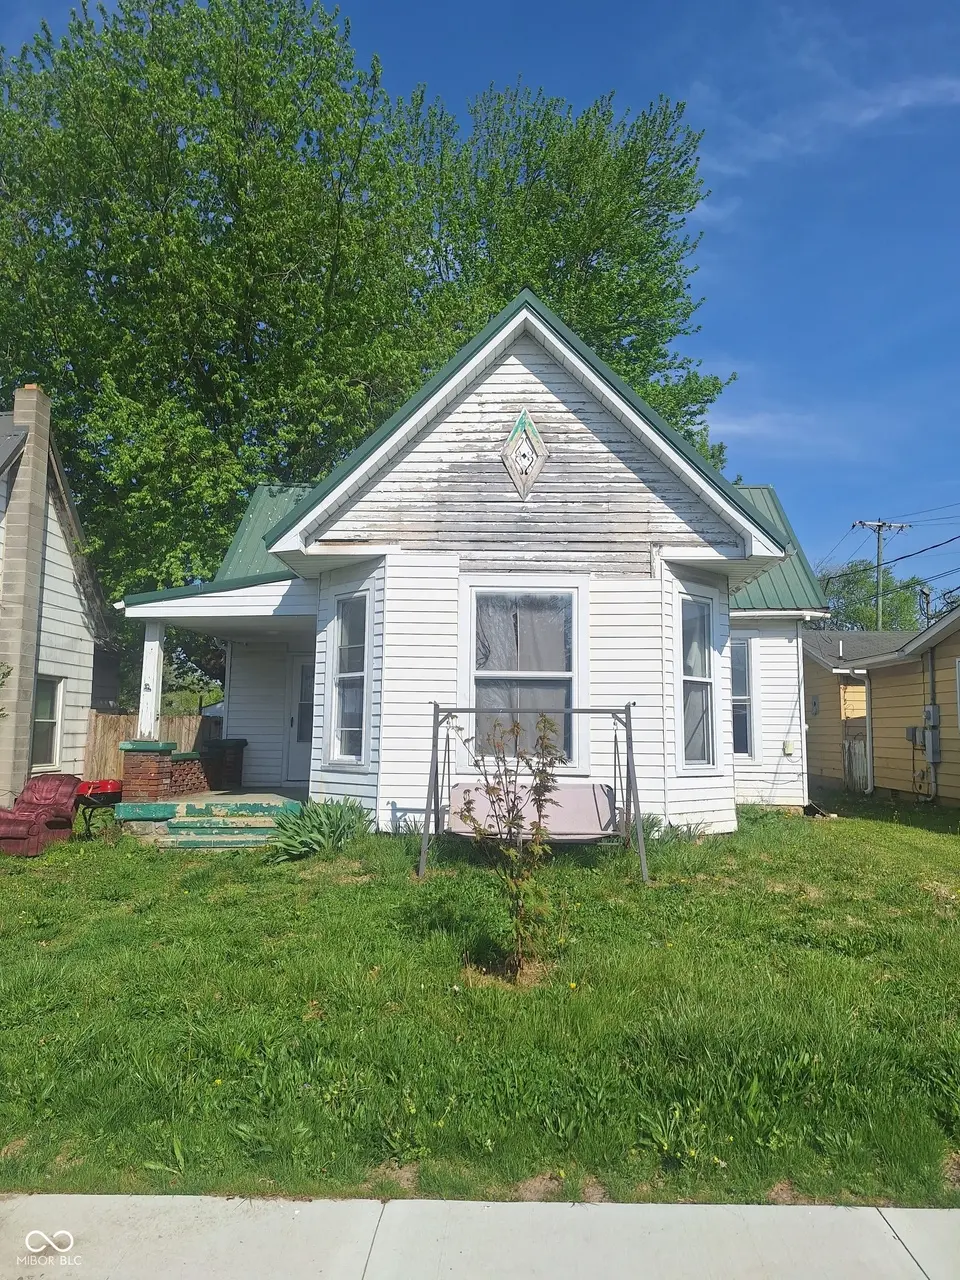
50 W Poplar St
North Vernon, IN 47265
$29,900B-
3 bd · 1.0 ba ·
1,240 sqft ·
Built 1912
· SingleFamily
· Pending
· 17 DOM
Cashflow @ list (25.0% down · 7.5%)
Estimated rent
$990/mo
Mortgage (P&I)
−$157
Tax + insurance
−$123
HOA
−$0
Vac / Maint / Mgmt
−$208
Net cashflow
$502/mo
Annual
$6,028/yr
Cap rate
26.45%
Cash-on-cash
72.00%
DSCR
4.20
1% rule
3.31%
Cash to close
$8,372
Investor read
- This is a 3-bed/1.0-bath single-family listed at $30k.
- At list price, monthly cash flow is $502 ($6k/yr) — positive.
- The deal already cash-flows at list — no discount required.
- Meets the 1% rule at list price ($990 rent vs $30k).
- It's been on market 17 days — a 2% lower offer ($29k) is reasonable based on typical stale-listing flexibility.
- Recommended offer: $29k (1.5% below list) — sets the bar for market timing.
- Local home prices are declining (-3.0%/yr); year-one equity from $207 of loan paydown is wiped out by about $897 of value loss. Plan a longer hold.
- Location reads 79/100 on livability (#29 in IN, #2,347 nationally) — a middle-class / working-renter tenant base. Strengths: cost of living A+, housing A+, health & safety A+; Watch: amenities D, schools D-, commute F.
- Jennings County School Corporation (rural): math 32% / reading 38% proficiency, ranked #194 of 301 in IN (top 64%) — families likely to look elsewhere, expect single-tenant / working-renter base with shorter leases.
- Watch-outs: property tax is 4.4% of price; built in 1912 — expect roof / HVAC / electrical / plumbing capex.
- Market conditions: 160 active listings in the ZIP; 6 comparable units currently listed for rent nearby; rentals lingering (median 44d on market — plan ~5-8 weeks vacancy on turnover, expect pricing pressure); 100% of comp listings sitting > 30 days — soft ceiling on asking rent; 84 units permitted in Jennings County in 2024 (0 in 5+ unit buildings).
- Jennings County population projected at -21% by 2050 — secular population decline; favor cash flow + early exit over multi-decade hold.
- At projected returns (-3.0% appreciation + 3.0% rent growth), your $8k cash investment doubles in ~2 years — after that, you're playing with house money.
- Cap rate 26.5% vs local median 4.1% in North Vernon — top-decile yield for the area; either an underpriced asset or a hidden risk that comps aren't pricing in. Stress-test before assuming the spread holds.
Questions for listing agent
- Built in 1912 — when were the roof, HVAC, electrical panel, plumbing, and water heater last replaced?
- Property tax is high relative to price — has the assessment been appealed recently, and will the sale trigger a re-assessment?
- Is there a deadline driving the sale (1031 exchange, divorce, estate, relocation)? That informs how much negotiation room exists.
- Schools are D-rated, which usually means shorter tenancies and higher turnover. Who's the typical renter profile here, and what's been the actual vacancy rate?
- What's the average days-on-market for RENTAL listings here right now (not sales)? A rising rental-DOM trend means longer vacancies and softer asking-rent achievability than the comps imply.
- What's the recent tenant-quality profile in this submarket — average credit score on applications, eviction rate, late-payment / NSF rate, and stable-employment percentage? A property-management company in the area should have these aggregated.
- How much new for-sale + rental construction is in the pipeline within 1–3 miles? Heavy new supply typically softens prices + rents 12–24 months out; constrained supply supports both.
CashFlowRE · CFR-S9CSAB32G3S3Q2
· Data 3 weeks ago
cashflowre.app · 2026-05-29