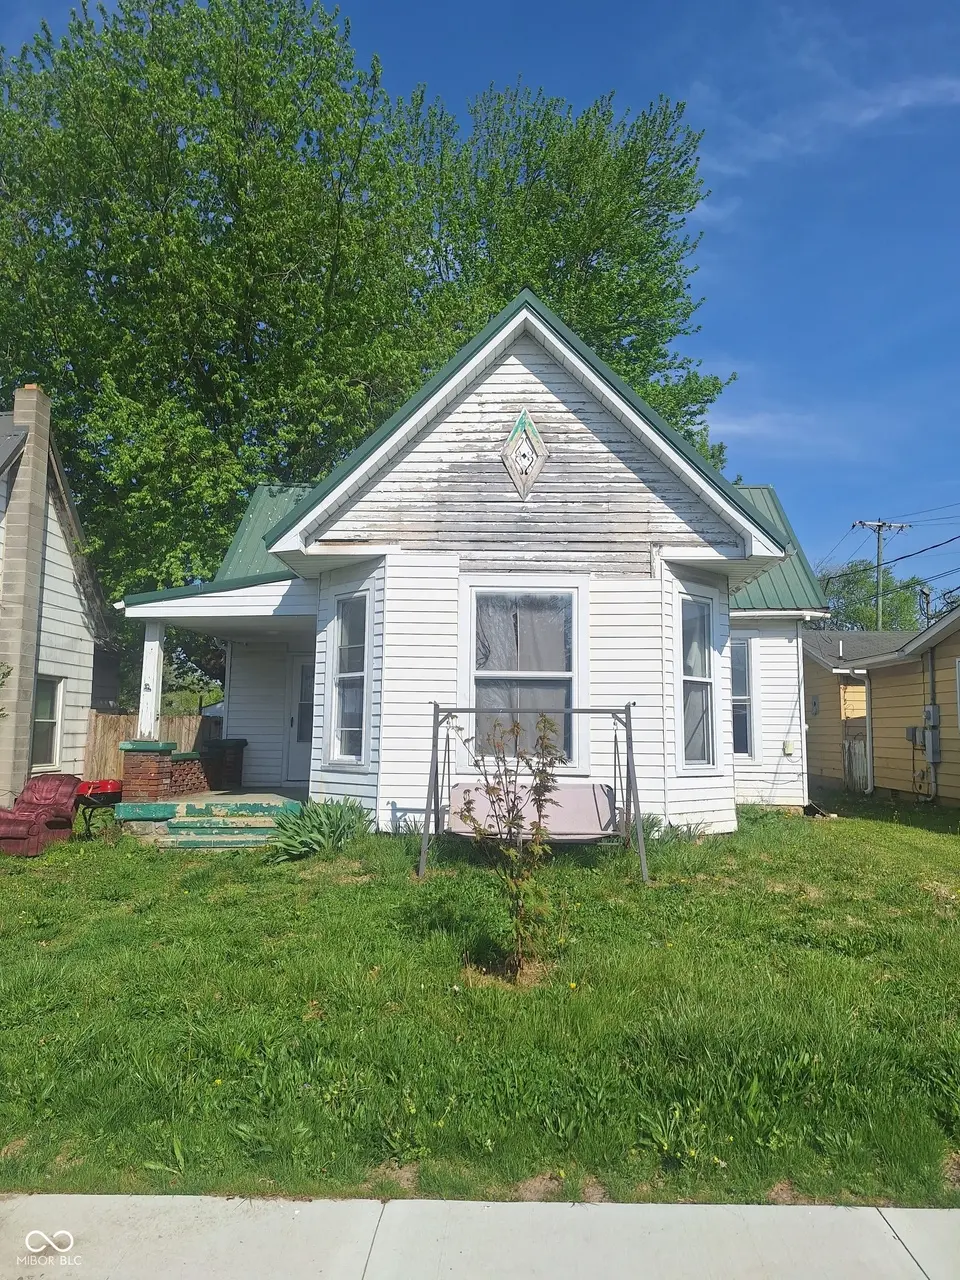
50 W Poplar St · North Vernon, IN
Flood risk 1/10 · Minimal
- FEMA flood zone
- X (unshaded)
- Chance of flooding over 30 yrs
- 0.0%
- Est. flood insurance / yr
- $473 – $860
Fire risk 3/10 · Minor
- Est. fire insurance / yr
- $717 – $1,331
Heat risk 4/10 · Minor
- Hot days now (above 105°F)
- 7 days/yr
- Hot days in 30 yrs
- 19 days/yr
Wind risk 2/10 · Minimal
- Chance of severe wind over 30 yrs
- 1.0%
Air-quality risk 2/10 · Minimal
- Unhealthy air days now
- 0 days/yr
- Unhealthy air days in 30 yrs
- 1 days/yr
Risk factors via First Street. Map © Google.
Why this score? — see what drove the B- grade
The composite is a weighted blend of 9 inputs, each scored 0–100. Each bar is that input's sub-score; the figure is the points it added to the 100-point composite (weight × sub-score).
- Cash flow +30.0/30.0
- 1% rule +10.0/10.0
- DSCR +10.0/10.0
- ARV discount +7.5/15.0
- Livability +4.0/5.0
- Schools +3.0/10.0
- Rent growth +2.5/5.0
- Condition / age +2.5/5.0
- Appreciation +0.0/10.0
$29,900
🖨 Deal sheet 📄 Offer letter ✓ Due diligence
Listing remarks
This single family home is great for investors or homeowners who want to earn some sweat equity. This three bedroom home features a large fenced back yard, covered porch, and detached garage. Needs a full renovation to bring out it's charm and full potential but is in a great location near the town center. Property will be sold as-is. Basement has standing water, please do not try to enter the basement. Masks are recommended when entering as home may have mildew or mold growth. Any appliances present will stay, but Seller does not guarantee function. Room sizes are approximate. Utilities are off and seller will not turn on. Hazardous property release is attached to the documents and MUST BE
Key facts
- Covered porch
- Fenced back yard
- Great location
Tags
Property features AI
Exterior
- Parking: - Detached 1-car garage
- Utilities: - Public water; - Municipal sewer connected; - Solid waste service available
- Home design: - Single-family residence; - Residential property in fixer condition; - Two levels
- Construction: - Wood and brick construction; - Block foundation
- Exterior features: - Covered patio; - Mini barn; - Full privacy fencing; - Sidewalks and street lights; - Mature trees
Interior
- Kitchen: - Eat-in kitchen
- Bedrooms: - Three bedrooms on the main level
- Flooring: - Hardwood floors
- Bathrooms: - One full bathroom (main level)
- Heating & cooling: - Forced air heating (natural gas); - Central air conditioning
- Interior features: - Hardwood floors; - Eat-in kitchen; - Formal living room
- Laundry & utility: - Laundry located in the basement
Neighborhood map
What this means for you Summary
Snapshot
- This is a 3-bed/1.0-bath single-family listed at $30k.
Deal economics
- At list price, monthly cash flow is $502 ($6k/yr) — positive.
- The deal already cash-flows at list — no discount required.
- Meets the 1% rule at list price ($990 rent vs $30k).
- Recommended offer: $29k (1.5% below list) — sets the bar for market timing.
- Cap rate 26.5% vs local median 4.1% in North Vernon — top-decile yield for the area; either an underpriced asset or a hidden risk that comps aren't pricing in. Stress-test before assuming the spread holds.
Location & tenants
- Location reads 79/100 on livability (#29 in IN, #2,347 nationally) — a middle-class / working-renter tenant base. Strengths: cost of living A+, housing A+, health & safety A+; Watch: amenities D, schools D-, commute F.
- Jennings County School Corporation (rural): math 32% / reading 38% proficiency, ranked #194 of 301 in IN (top 64%) — families likely to look elsewhere, expect single-tenant / working-renter base with shorter leases.
- Market conditions: 160 active listings in the ZIP; 6 comparable units currently listed for rent nearby; rentals lingering (median 44d on market — plan ~5-8 weeks vacancy on turnover, expect pricing pressure); 100% of comp listings sitting > 30 days — soft ceiling on asking rent; 84 units permitted in Jennings County in 2024 (0 in 5+ unit buildings).
Forward outlook
- Local home prices are declining (-3.0%/yr); year-one equity from $207 of loan paydown is wiped out by about $897 of value loss. Plan a longer hold.
- Jennings County population projected at -21% by 2050 — secular population decline; favor cash flow + early exit over multi-decade hold.
- At projected returns (-3.0% appreciation + 3.0% rent growth), your $8k cash investment doubles in ~2 years — after that, you're playing with house money.
Negotiation context
- It's been on market 17 days — a 2% lower offer ($29k) is reasonable based on typical stale-listing flexibility.
Risks & watch-outs
- Watch-outs: property tax is 4.4% of price; built in 1912 — expect roof / HVAC / electrical / plumbing capex.
Questions for the listing agent
- Built in 1912 — when were the roof, HVAC, electrical panel, plumbing, and water heater last replaced?
- Property tax is high relative to price — has the assessment been appealed recently, and will the sale trigger a re-assessment?
- Is there a deadline driving the sale (1031 exchange, divorce, estate, relocation)? That informs how much negotiation room exists.
- Schools are D-rated, which usually means shorter tenancies and higher turnover. Who's the typical renter profile here, and what's been the actual vacancy rate?
- What's the average days-on-market for RENTAL listings here right now (not sales)? A rising rental-DOM trend means longer vacancies and softer asking-rent achievability than the comps imply.
- What's the recent tenant-quality profile in this submarket — average credit score on applications, eviction rate, late-payment / NSF rate, and stable-employment percentage? A property-management company in the area should have these aggregated.
- How much new for-sale + rental construction is in the pipeline within 1–3 miles? Heavy new supply typically softens prices + rents 12–24 months out; constrained supply supports both.
Investment metrics
- 1% rule
- 3.31% ✓
- Cap rate
- 26.45%
- Cash-on-cash
- 72.00%
- DSCR
- 4.20
- GRM
- 2.5
CMA / ARV
- ARV (median comp)
- $181,992
- List price
- $29,900
- Delta
- -83.57%
- Verdict
- UNDERPRICED
- Comps
- 20 within 1.0 mi
Show comp detail 12 sales within ~0.75 mi
| Address | Dist | Beds/Ba | Sqft | Sold | Price | $/sf | Match |
|---|---|---|---|---|---|---|---|
| 180 W Baker St | 0.35mi | 3/2.0 | 1,280 (+3%) | 0mo | $214,900 | $168 | 74 |
| 115 Platter Dr | 0.32mi | 3/1.0 | 1,200 (-3%) | 14mo | $151,000 | $126 | 68 |
| 404 Pleasant Dr | 0.59mi | 3/2.0 | 1,232 (-1%) | 2mo | $232,500 | $189 | 66 |
| 148 W O&m Ave | 0.31mi | 3/2.0 | 1,200 (-3%) | 13mo | $195,000 | $163 | 65 |
| 210 Norris Ave | 0.53mi | 2/2.0 (-1) | 1,224 (-1%) | 0mo | $175,000 | $143 | 64 |
| 46 Noon Dr | 0.59mi | 3/1.0 | 1,300 (+5%) | 2mo | $145,000 | $112 | 63 |
| 131 Meadow Ln | 0.61mi | 3/2.0 | 1,290 (+4%) | 0mo | $205,000 | $159 | 61 |
| 201 Hayden Pike | 0.38mi | 3/1.0 | 1,080 (-13%) | 3mo | $175,000 | $162 | 58 |
| 190 W Baker St | 0.36mi | 3/2.0 | 1,119 (-10%) | 9mo | $155,000 | $139 | 56 |
| 438 4th St | 0.58mi | 4/1.0 (+1) | 1,156 (-7%) | 5mo | $163,500 | $141 | 53 |
| 312 Harms St | 0.69mi | 3/1.0 | 1,161 (-6%) | 11mo | $190,000 | $164 | 48 |
| 325 Franklin St | 0.51mi | 3/2.0 | 1,075 (-13%) | 8mo | $200,000 | $186 | 43 |
Match score weights: distance 35% · size 25% · config 20% · recency 20%. Top-matched comps best support the ARV.
Projected returns pro-forma
-3.0% appreciation · 3.0% rent growth · sell at horizon
- IRR
- 71.7%
- Equity multiple
- 4.25×
- Total profit
- $27,208
- Equity at exit
- $4,458
- IRR
- 75.7%
- Equity multiple
- 8.78×
- Total profit
- $65,132
- Equity at exit
- $2,585
Cash invested: $8,372 (down + closing). Projections, not guarantees.
Landlord ↔ Tenant lean methodology
- Overall (STATE)
- 90 Strongly Landlord-Friendly
- State Indiana
- 90 Strongly Landlord-Friendly · R+11
- County
- — inherits STATE
- City
- — inherits STATE
ZIP-level market 47265
- Home prices YoY
- -31.5%
- Active inventory
- 160
- Price-to-rent
- 2.5×
Monthly cashflow live
- Estimated rent
- $990 high interval (Pro) →
- Mortgage (P&I)
- −$157
- Tax from tax record
- −$110 /mo · $1,326/yr
- Insurance
- −$12
- HOA
- −$0
- Vacancy / Maint / Mgmt
- −$208
- Net cashflow
- $502
Break-even live
UW: 25.0% down · 7.5% · 30yr · 1.5% tax · 5.0% vac · 8.0% maint · 8.0% mgmt
Financing live
Cash to close
- Down payment
- $7,475
- Closing costs
- $897
- Reserves months
- —
- Total cash needed
- —
Loan-product check · same deal, 3 products live
Conventional
25% down · 7.5% · 30yr
- Down + closing
- —
- Monthly P&I
- —
- Monthly cashflow
- —
- DSCR
- —
- Eligible?
- —
Personal DTI + credit; lowest rate.
DSCR
20% down · 8.5% · 30yr
- Down + closing
- —
- Monthly P&I
- —
- Monthly cashflow
- —
- DSCR
- —
- Eligible?
- —
No personal income docs; deal must DSCR.
Hard money
10% down · 12.0% · 12mo
- Down + closing
- —
- Monthly P&I
- —
- Monthly cashflow
- —
- DSCR
- —
- Eligible?
- —
Short-term bridge; refi at stabilization.
Rent comps 6 comps
| Address | Beds | Baths | Sqft | Rent | $/sqft | DOM | Units | Dist |
|---|---|---|---|---|---|---|---|---|
| 1450 Oak Meadows Dr North Vernon, IN | 2.0–3.0 | 1.0–2.0 | 872 | $975 | $1.12 | 44d | 1 | 0.36mi |
| 206 N 7th St North Vernon, IN | 2.0 | 1.0 | 1248 | $950 | $0.76 | 44d | 1 | 0.56mi |
| 205 Long St North Vernon, IN | 2.0 | 1.0 | 750 | $875 | $1.17 | 44d | 1 | 0.71mi |
| 450 N Greensburg St North Vernon, IN | 2.0 | 1.0 | 720 | $875 | $1.22 | 44d | 1 | 0.87mi |
| 8 Westside Ct North Vernon, IN | 2.0 | 1.0 | 870 | $950 | $1.09 | 44d | 1 | 0.89mi |
| 2985 N State St North Vernon, IN | 2.0 | 1.0 | 1055 | $1,350 | $1.28 | 44d | 1 | 0.99mi |
Listing history 1 events
-
2026-05-11$29,900 Active 813-char remark
ⓘ Source: listings_history table (triggers on properties + properties_extension) + one-shot
backfill from property_details.listing_events for pre-trigger history.
Tax reassessment forecast IN · Partial reset (capped growth)
- Current annual tax
- $1,326 · $110/mo
- Projected year-2 tax
- $1,326 · $110/mo
- Expected delta
- $0/yr ($0/mo · 0.0%)
ⓘ Screening estimate from a state-policy table — verify with the county assessor before closing.
Climate risk First Street
- Flood 1/10 Low FEMA zone X (unshaded) · 0% chance over 30 yrs
- Wildfire 3/10 Moderate
- Heat 4/10 Moderate 7 d/yr ≥105°F today · 19 d/yr by 30 yrs out
- Wind 2/10 Low 100% chance of damaging wind over 30 yrs
- Air quality 2/10 Low 0 unhealthy d/yr today · 1 by 30 yrs out
Nearby sold comps map
Loading sold comps map…
Walkable amenities ~0.75 mi
Loading nearby amenities…
Taxation est. · year 1
- Rental income
- $11,880
- − Mortgage interest
- −$1,675
- − Property taxes
- −$1,326
- − Insurance
- −$150
- − Repairs & maintenance
- −$950
- − Management
- −$950
- − Depreciation
- −$870
- Taxable income
- $5,959
- Est. tax owed @ 24.0%
- −$1,430
- After-tax cash flow
- $4,598/yr
For passive investors: Depreciation is non-cash, so a rental often shows a tax loss while cash-flowing — sheltering income. Rental losses are passive: they offset passive income freely, and up to $25,000/yr can offset ordinary (W-2) income if you actively participate and your MAGI is under $100k (phasing out to $0 by $150k); unused losses carry forward. On sale, claimed depreciation is recaptured at up to 25%, and gains may owe capital-gains tax (a 1031 exchange can defer both). Figures are a year-1 estimate at your 24.0% rate — not tax advice; consult a CPA.
Schools (NCES district)
- District
- Jennings County School Corporation
- NCES district ID
- 1805190
- Math proficiency
- 32% ▼ -11.00%
- Reading proficiency
- 38% ▼ -6.00%
- Median HH income
- $45,418
- Composite
- 29.89/100
- National rank
- #6394
- State rank
- #194 of 301 in IN
Livability — North Vernon
- Score
- 79/100
- State rank
- #29
- US rank
- #2347
Category grades
Schools grade is shown separately in the Schools card above.
Census & demographics
- Census place
- North Vernon, IN
- City population
- 20,981
- Population (ZIP)
- 20,981
Population outlook (Jennings County) Hauer SSP2
- Today (2025)
- 26,584 people
- By 2030
- 25,591 · -3.7%
- By 2040
- 23,423 · -11.9%
- By 2050
- 20,973 · -21.1%
- By 2075
- 15,445 · -41.9%
- By 2100
- 10,714 · -59.7%
Race, ethnicity, and origin ACS 2023
- Neighborhood character
- Predominantly White (92%)
- Race & ethnicity
- White 92% Hispanic / Latino 4% Two or more races 3%
- Common ancestry
- Slovak 2% Romanian 1% Italian 1%
- Foreign-born
- 1% · Canada
- Languages at home
- 96% English-only · Spanish 2% German/W. Germanic 1%
Political lean MEDSL · Jennings
- 2024 margin
- Solid R (+58.8) · D 19.7% · R 78.5% · Other 1.8%
- 2008→2024 swing
- -50.8pp toward R · 2008: -8.0pp · 2024: -58.8pp
- All cycles
- 2024: R+58.8 2020: R+56.9 2016: R+52.7 2012: R+22.4 2008: R+8.0
Not yet ingested
- Civics
- —
Market trends
- HPI YoY
- ▼ -107.36%
- Current HPI
- 233.0275
- Rent YoY
- —
- Metro
- —
- State GDP YoY
- ▲ 2.90%
- F500 in state
- 18
Industry mix (Fortune 500 HQ in IN)
| Industry | F500 HQs | Revenue |
|---|---|---|
| Industrial Machinery | 2 | $37B |
|
||
| Healthcare | 1 | $177B |
|
||
| Pharmaceuticals | 1 | $45B |
|
||
| Metals / Steel | 1 | $18B |
|
||
| Agriculture | 1 | $17B |
|
||
| Packaging | 1 | $12B |
|
||
Price history
+18.9% since first listed3 events — show timeline
- 2026-06-12 Sold (MLS) $35,555 MIBOR as Distributed by MLS Grid
- 2026-05-28 Pending — MIBOR as Distributed by MLS Grid
- 2026-05-11 Listed $29,900 MIBOR as Distributed by MLS Grid
Property tax history
-2.3%/yrLatest (2024): $1,326 · -1.4% YoY. Source: county tax records.
Cash-flow waterfall
monthlySold comps — $/sqft
last 12 mo · ≤1 miLoading sold comps…