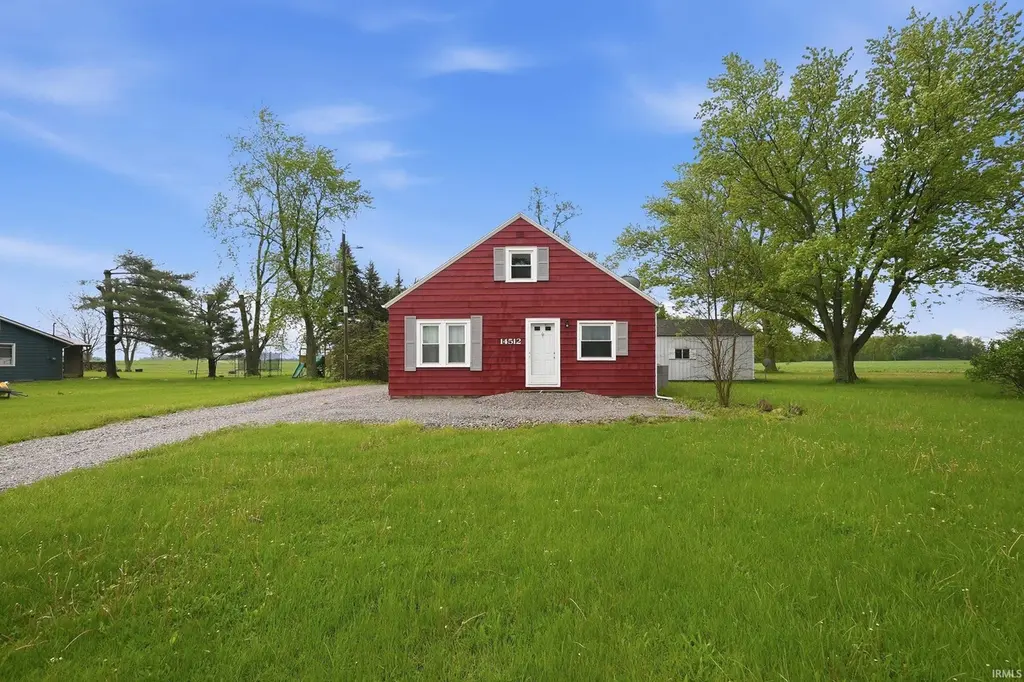
14512 Dawkins Rd
New Haven, IN 46774
$220,000D+
3 bd · 1.0 ba ·
1,792 sqft ·
Built 1900
· SingleFamily
· Pending
· 10 DOM
Cashflow @ list (25.0% down · 7.5%)
Estimated rent
$1,642/mo
Mortgage (P&I)
−$1,154
Tax + insurance
−$171
HOA
−$0
Vac / Maint / Mgmt
−$345
Net cashflow
$-27/mo
Annual
$-329/yr
Cap rate
6.14%
Cash-on-cash
-0.53%
DSCR
0.98
1% rule
0.75%
Cash to close
$61,600
Investor read
- This is a 3-bed/1.0-bath single-family listed at $220k.
- At list price, monthly cash flow is $-27 ($-329/yr) — negative.
- To cash-flow at today's rent, offer at most $215k (2.2% below list).
- To meet the 1% rule (rent ≥ 1% of price), the offer needs to be $164k (25.4% below list).
- Only 10 days on market — expect competitive offers; lowballing is unlikely to land.
- Recommended offer: $164k (25.4% below list) — sets the bar for 1% rule.
- Local home prices are declining (-3.0%/yr); year-one equity from $2k of loan paydown is wiped out by about $7k of value loss. Plan a longer hold.
- Location reads 70/100 on livability (#149 in IN) — a middle-class / working-renter tenant base. Strengths: cost of living A+, housing A+, crime B+; Watch: employment D, amenities F, commute F.
- East Allen County Schools (suburban): math 36% / reading 47% proficiency, ranked #122 of 301 in IN (top 40%) — families likely to look elsewhere, expect single-tenant / working-renter base with shorter leases.
- Zoned schools: Heritage Elementary School (math 36% / reading 40%, grade F, #538 of 994 statewide, top 54%, 508 students, 61% FRL); Woodlan Jr/Sr High School (math 35% / reading 52%, grade F, #191 of 369 statewide, top 52%, 727 students, 31% FRL) — zoned schools at 46% FRL track the district average.
- Watch-outs: built in 1900 — expect roof / HVAC / electrical / plumbing capex.
- Market conditions: 180 active listings in the ZIP; 1,861 units permitted in Allen County in 2024 (576 in 5+ unit buildings).
- Allen County population projected at +10% by 2050 — modest demand growth; plan on rents tracking national, not racing it.
- 2 sale attempts since 4y ago with the ask held roughly flat each time — persistent listings suggest the price (not the market) is what's stuck; bring a comps-based counter.
- Current owner paid $180k; 23% above their basis — modest negotiation headroom, anchor on the comps not their cost.
- Cap rate 6.1% vs local median 4.8% in New Haven — meaningfully above typical; check what's discounted (condition, days-on-market, listing class) to confirm the premium yield is real.
Questions for listing agent
- What do current leases actually rent for vs. the listed asking? Can we see a recent rent roll and the last 12 months of T-12 income?
- Built in 1900 — when were the roof, HVAC, electrical panel, plumbing, and water heater last replaced?
- Is there a deadline driving the sale (1031 exchange, divorce, estate, relocation)? That informs how much negotiation room exists.
- Schools are D-rated, which usually means shorter tenancies and higher turnover. Who's the typical renter profile here, and what's been the actual vacancy rate?
- The area grade is low — what's the realistic commute time and amenity access for the typical tenant pool here? Any planned neighborhood developments (good or bad) we should know about?
- What's the average days-on-market for RENTAL listings here right now (not sales)? A rising rental-DOM trend means longer vacancies and softer asking-rent achievability than the comps imply.
- What's the recent tenant-quality profile in this submarket — average credit score on applications, eviction rate, late-payment / NSF rate, and stable-employment percentage? A property-management company in the area should have these aggregated.
- How much new for-sale + rental construction is in the pipeline within 1–3 miles? Heavy new supply typically softens prices + rents 12–24 months out; constrained supply supports both.
CashFlowRE · CFR-SA7MVB23DX44S3
· Data 4 weeks ago
cashflowre.app · 2026-05-29